
Intended Learning Outcomes
At the end of this section students should be able to complete the following tasks.
- Describe the randomForest algorithm.
- Identify the only parameter which affects their performance.
- Explain the terms variable importance and case proximity.
- Interpret the ouptut from a randomForest analysis using the R function.
Background
Decision trees are not without their problems. For example, they can be less accurate than methods such as SVM (support Vector Machines) and the structure of the trees may lack stability because small changes to the training data produce significant changes to the tree, such as the identity of the split variables.
Even though the structure lacks stability, accuracy may be affected much less. Breiman and Cutler (2004a, pdf file) noted that if you "change the data a little you get a different picture. So the interpretation of what goes on is built on shifting sands".
Breiman (2001) developed an algorithm, called RandomForests (a trademark of Salford Systems), that is said to overcome many of these shortcomings. RandomForest classifiers generally perform well in the comparisons with other classifiers. Breiman and Cutler (2004b) listed some of the important features of RandomForests.
- Accuracy that equals or exceeds many current classifiers and they cannot overfit the training data.
- Efficient (fast) with large data bases and can handle thousands of predictors without variable-selection routines.
- Estimate the importance of each predictor.
- Generate an unbiased estimate of the generalization error.
- Robust algorithms to deal with missing data and for balancing the error if class proportions are markedly different.
- Compute proximities between pairs of cases that can be used in clustering and identifying outliers.
- An experimental method for detecting variable interactions.
- Generated forests can be saved for future use on other data.
Algorithm
A 'forest' of many trees is generated such that each tree differs with respect to the composition of the training cases and the predictors used at each node. Each training set is a bootstrapped sample from the original data, with n equal to the original sample size. The number of predictors available for each node in a tree (m) is much less than the total available. This is because a random set of m predictors is selected separately for each node in the tree. This means that the combination of predictors considered for the splits are unlikely to be same for any node in the tree. The value of m is the only adjustable parameter to which random forests are sensitive.
No pruning is used, instead each tree is grown to the largest extent possible because this helps to keep the bias low. Breiman (2001, Machine Learning, 45:5-32) showed that the forest error rate depends on two things.
- Increasing the strength (accuracy) of the individual trees decreases the forest error rate
- As pairs of trees become more correlated the forest error rate increases.
Reducing the number of potential predictors (m) reduces both the correlation and the strength. It is, therefore, important to find the optimum value for m to balance these opposing effects. Fortunately the optimal range for m is quite wide and an out-of-bag error rate can be used to find an appropriate value.
Each tree is built from a bootstrapped sample that typically contains about two thirds of the cases. The remaining third, the out-of-bag sample, is run through the finished tree. Some trees correctly predict the class of these out-of-bag cases, others will not. The proportion of times that a case is misclassified, averaged over all cases, is the out-of-bag error rate. The out-of-bag error rate is also part of the recommended way of deciding on an appropriate value for m (Breiman and Cutler, 2004, pdf file). They suggest a starting value that is the square root of the total number of predictors. About 25 trees should be run with increasing and decreasing values of m until the minimum out-of-bag error is obtained.
Variable Importance and Case Similarities
RandomForests can estimate the importance of each variable to the classes and the associations between cases. In order to estimate the importance of a predictor its values in the ith tree are permutated randomly among all of the out-bag-cases. This is a similar approach to that used in the Mantel test. A predictor's raw importance score is the difference in accuracy between the tree with the unaltered, and the permutated values. If this is repeated for all predictors, across all trees it a z-score is obtained for each predictor from its mean raw importance score divided the standard error of the raw importance scores. Z-scores can are used to rank the predictors, with the most important predictors having the largest z-scores.
The association, or proximity, between cases is the number of times that they occur together in the same terminal node. These counts are normalized by dividing by the number of trees, producing a proximity matrix that can be analysed using a metric scaling method. Apart from showing the proximity of cases these distance matrices, and their metrically scaled projections, can be used to:
- replace missing values,
- locate outliers and
- investigate how the predictors separate the classes by locating 'prototypes'.
A prototype definition for class i begins by finding the case which has largest number of class i cases among its k nearest neighbours. The medians of the values for these cases, across all predictors, are the medians for the class i prototype. The upper and lower quartiles for these neighbours also provide evidence for the stability of the prototype medians. The procedure can be repeated to find additional class prototypes, but with a constraint such that the cases in the previous neighbourhood are not considered.
Software
Liaw and Wiener (2006, pdf file) have written an R function that is based on the original Fortran program written by Breiman and Cutler. In addition to the usual R manual pages it is worth consulting Breiman's (2002, pdf file) notes on running the original program.
Example Analysis
This analysis uses an artificial data set with two classes (A, B) and six potential predictors (v1 - v6). There is a training set with 100 cases from each class and a test set with 50 from each class. Some basic descriptive information is given below. Data files can be downloaded as SPSS .SAV files (training and testing data) or a single excel document.
Training data
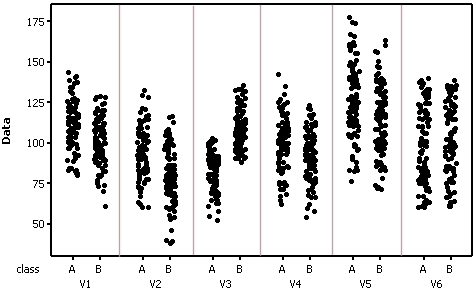
	Variable class  Mean    SE Mean Minimum  Maximum
	V1       A      111.43   1.50    80.28   143.85
	         B      101.20   1.44    61.12   128.67
	V2       A       93.53   1.55    59.96   132.41
	         B       79.64   1.69    38.24   116.31
	V3       A       83.77   1.14    52.20   102.97
	         B      108.38   1.19    87.90   135.75
	V4       A      100.92   1.61    62.36   142.48
	         B       91.64   1.52    54.22   123.00
	V5       A      126.15   2.28    76.04   177.41
	         B      115.01   2.14    71.12   163.22
	V6       A       99.26   2.33    60.05   139.80
	         B      101.47   2.31    60.73   138.72
Individual value plots (training data) by class and variable
Test data
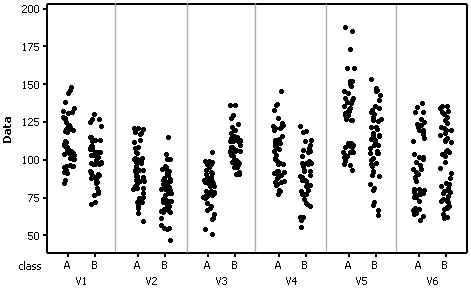
	Variable class  Mean     SE Mean  Minimum  Maximum
	V1       A      113.06     2.23    84.91   148.45
	         B      100.12     2.01    70.79   130.38
	V2       A       93.14     2.22    59.55   121.11
	         B       78.84     1.99    46.84   114.97
	V3       A       82.28     1.65    50.96   105.43
	         B      109.21     1.54    90.61   136.67
	V4       A      104.60     2.43    77.76   145.69
	         B       90.07     2.23    55.27   122.33
	V5       A      127.27     3.31    93.18   188.43
	         B      112.05     3.17    63.38   153.73
	V6       A       95.48     3.19    60.10   137.96
	         B       98.55     3.37    61.70   135.59
Individual value plots (testing data) by class and variable
The first command reads in data from an SPSS data file (rf_data_train.SAV) to an R workspace called spssdata. The R 'foreign' package must be loaded for this command to function.
> spssdata <-read.spss("f:/rf_data_train.SAV",to.data.frame=TRUE)
The next command runs the randomForest function with all of the analysis details contained in an object called spss.rf. The class variable is called CLASS in this data file and all of the predictors are used. The data are in the spssdata data frame. Variable importance and usage statistics, plus case proximity measures, are retained in the spss.rf object. 5000 trees are created. Finally, a plot of variable importance is generated.
	> spss.rf <-randomForest(CLASS ~ ., data=spssdata, importance=TRUE,
	proximity=TRUE, varUsed=TRUE, ntree=5000, varImpPlot=TRUE)
A summary of the analysis is produced by the next command.
	> print(spss.rf)

	Call:
	randomForest(formula = CLASS ~ ., data = spssdata, importance = TRUE,
	proximity = TRUE, ntree = 5000, varImpPlot = TRUE, varUsed = TRUE)
				   Type of random forest: classification
						 Number of trees: 5000
	No. of variables tried at each split: 2

		OOB estimate of  error rate: 10.5%
	Confusion matrix:
		A        B        class.error
	A       89       11        0.11
	B       10       90        0.10
The summary re-iterates the analysis details and tells us what the OOB (Out-Of-Bag) error rate is for all cases and the two classes. WARNING: because of the stochastic parts of this algorithm you are likely to get slightly different results.
> varImpPlot(spss.rf)
The variable importance plot shows that the orer of importance (with respect to the classes) is V3, V2, V1 and V4. V5 and V6 are in a different order for the accuracy and GINI index plots but both are relatively unimportant.
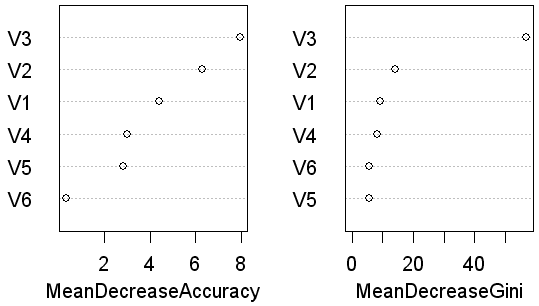
The importance plots are supported by the varUsed counts (how many times each variable was used in a node. The rank order is V3 (24662), V2 (17908), V3 (15664), V4 (15021), V6 (13477) and V5 (12933).
	> varUsed(spss.rf, by.tree=FALSE, count=TRUE)
	[1] 15664 17908 24662 15021 12933 13477
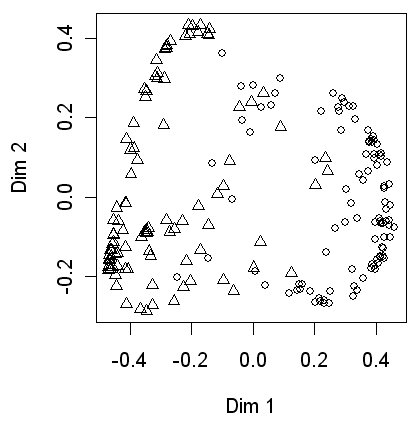
Next a MDS plot based on the similarities between cases, i.e. the number of times that cases were placed in the same terminal nodes. This shows that the two classes are quite widely separated but there is some overlap, for example the upper center of the plot.
	> MDSplot(spss.rf, spssdata$CLASS, palette=rep(1, 2),
	  pch=as.numeric(spssdata$CLASS))
Finally the performance of the tree is tested on the independent data. After reading the SPSS file into a new data frame called testdata the predictions are produced and stored in the spss.pred object. Printing this shows the predicted classes for these 100 cases. The first 50 are class A, the second 50 are class B. Four class A cases (43, 44, 48 and 49) are misclassified as B and two class B cases (55 and 59) are misclassified as A.
 	> testdata <-read.spss("f:/rf_data_test.SAV",to.data.frame=TRUE)
	>
	> spss.pred<-predict(spss.rf, testdata, type="response", norm.votes=TRUE,
	predict.all=FALSE, proximity=FALSE, nodes=FALSE)
	> print(spss.pred)
	  [1] A    A    A    A    A    A    A    A    A    A    A    A    A
	 [14] A    A    A    A    A    A    A    A    A    A    A    A    A
	 [27] A    A    A    A    A    A    B    A    A    A    A    A    A
	 [40] A    A    A    B    B    A    A    A    B    B    A    B    B
	 [53] B    B    A    B    B    B    A    B    B    B    B    B    B
	 [66] B    B    B    B    B    B    B    B    B    B    B    B    B
	 [79] B    B    B    B    B    B    B    B    B    B    B    B    B
	 [92] B    B    B    B    B    B    B    B    B
	Levels: A    B
There is also an option to identify class prototypes. The three components of this command identify the dataframe (all variables except the first one which is the class), the class labels (the first variable in the dataframe) and the location of the case proximities.
	> class.protos <- classCenter(spssdata[,-1], spssdata[,1], spss.rf$prox)
	> print(class.protos)
	            V1      V2       V3      V4       V5      V6
	A        112.4385 93.0435  85.3755 104.001 127.3365  98.638
	B         99.3080 77.6280 106.7030  90.353 115.4420 102.835
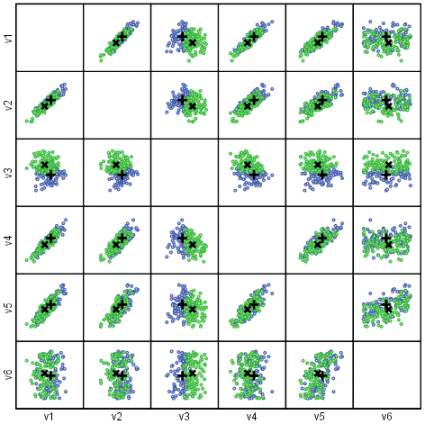
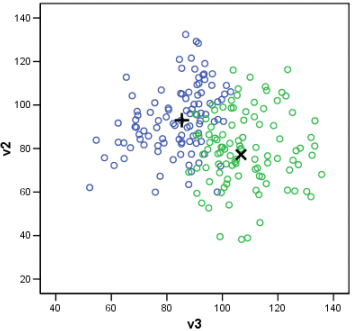
The class prototypes are shown below by a plus sign for class A and a cross for class B. The first plot is a matrix plot of all pairwise variables. Note that in the plot of V5 against V6 (the least importance variables) the two prototypes are close together. The second plot is the two most important variables (V3 and V2).
Resources
- Breiman, L. 2002. Manual on setting up, using, and understanding Random Forests V3.1. http://oz.berkeley.edu/users/breiman/Using_random_forests_V3.1.pdf
- Breiman, L. and Cutler, A. 2004a. Interface Workshop - April 2004. http://stat- http://stat-www.berkeley.edu/users/breiman/RandomForests/interface04.pdf
- Breiman, L. and Cutler, A. 2004b. Random Forests. http://stat-www.berkeley.edu/users/breiman/RandomForests/cc_home.htm
- Liaw, A. and Wiener, A. 2006. The randomForest package. http://cran.r-project.org/doc/packages/randomForest.pdf