Principal Components Analysis
Brief history
- Developed by Pearson (1901) and Hotelling (1933).
- Assumes that if we have data for a large number of variables (k), obtained from n cases, there may be a smaller set of derived variables which retain most of the original information e.g.:
| case | ht (x1) | wt(x2) | age(x3) | sbp(x4) | heart rate (x5) |
|---|---|---|---|---|---|
| 1 | 175 | 1225 | 25 | 117 | 56 |
| 2 | 156 | 1050 | 31 | 122 | 63 |
| n | 202 | 1350 | 58 | 154 | 67 |
- Weight and height are probably highly correlated, and sbp (systolic blood pressure) and heart rate may be related.
- Imagine 2 new variables, pc1 and pc2, where pc1 is a combination of weight and height while pc2 is a combination of sbp, age and heart rate. Hence, the number of variables could be reduced from 5 to 2 with little loss of information.
- These new variables, derived from the original variables, are called components.
- Thus, the main aim of PCA is to reduce dimensionality with a minimum loss of information. This is achieved by projecting the data onto fewer dimensions that are chosen to exploit the relationships between the variables.
Outline
Projecting data onto fewer dimensions may sound like science fiction but you are all familiar with it.

The golden eagle is 3-dimensional, but its photograph is 2-dimensional. In other words its image has been projected onto fewer dimensions. Although now represented in fewer dimensions it can still be recognised as a golden eagle, because the image retains a significant amount of information. The process of projection can be described mathematically, but here a non-mathematical metaphor is used.
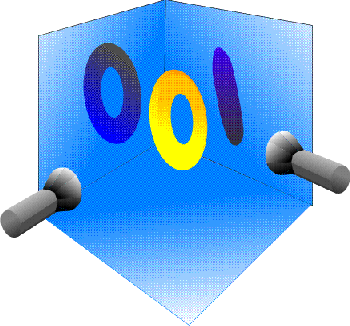
You can try this at home, all that you need is a doughnut, a torch and a dark room! Imagine a doughnut suspended in space. Shine a light onto this doughnut from two different directions. These lights cast shadows onto two 'screens'. The nature of the shadow is dependent on the position of the torch.

The two shadows are different projections of the same 3-dimensional doughnut onto the 2-dimensional screens. If you were sitting behind the screen you would only see the shadow. Whether or not you could recognise these shadows as being cast by a doughnut would depend on their orientations. An obvious, but important point, is that the donought never changes shape even though the projections (shadows) are quite different.
We have seen that objects can be projected onto fewer dimensions. Some projections retain a lot of information about the object while others do not. Now consider two alternative methods of obtaining the projections.
- move the doughnut and keep the torches stationary
- keep the doughnut stationary and move the torches.
The projections obtained by these alternative methods would be equivalent. Remember this when you begin to think about projections of data rather than doughnuts.
The mathematical approach of PCA is the second of these alternatives. The data are never moved, instead we move the axes. This is equivalent to moving the torches. Because of the need to make the data visible it may appear that the data moved, this is an illusion.
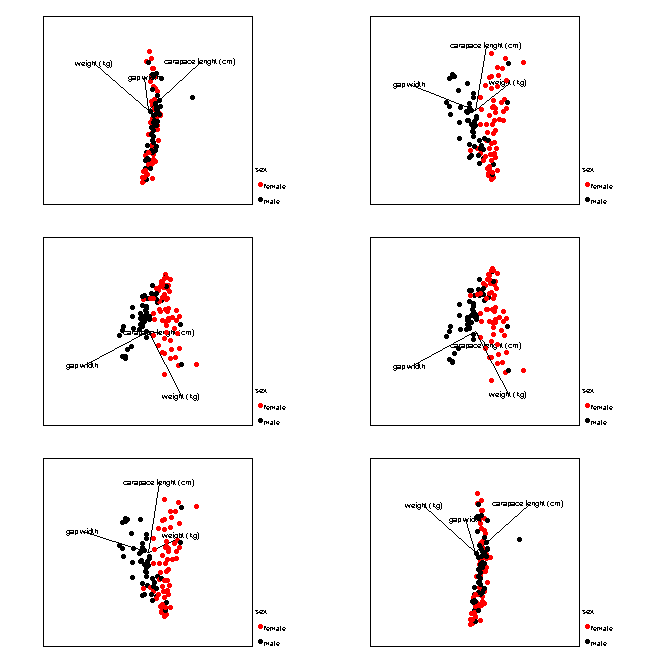
In the next example a real data set is shown in a variety of projections. Cases are labelled with respect to their sex. Note how, depending on the projection, you obtain different information about the relationships between the three variables and differences between the sexes.

What does PCA do?
PCA decides which, amongst all possible projections, are the best for representing the structure of your data. A projection is selected so that the maximum amount of information, measured in terms of variability, is retained in the smallest number of dimensions.
Which projections of the data above would you retain?
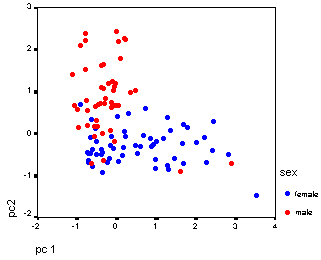
PCA's solution is shown below.

The next section outlines the basic of matrix algebra. You can skip this and go straight to the section that describes the mathematical foundations of PCA. Alternatively you can skip even further to the explanation of eigen values

