PCA with rotation (Factor Analysis)
Three analyses are presented.
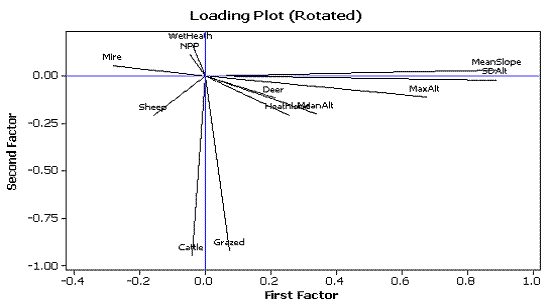
- Factor analysis extracting 12 components with a rotated solution.
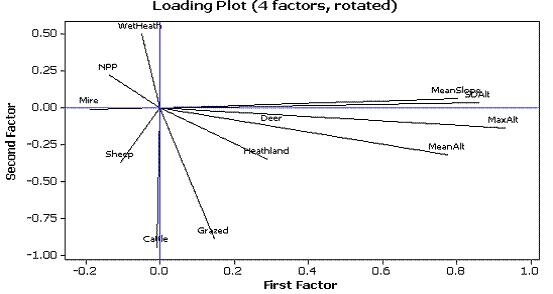
- Factor analysis extracting 4 components (eigen values >1) with a rotated solution.
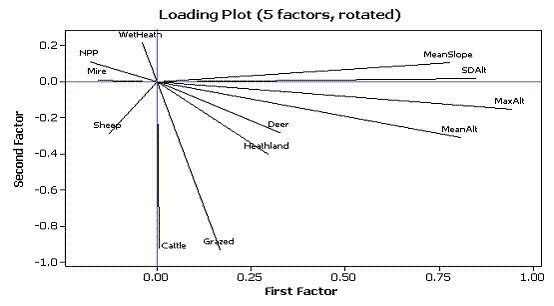
- Factor analysis extracting 5 components with a rotated solution.
An unrotated Factor Analysis of 12 factors is not presented because the results are identical to the previous PCA (except that the loadings are rescaled coefficients).
Analysis 1: Factor analysis extracting 12 components with a rotated solution
NOTE: Although they are present in the output, coefficients and loadings are not shown for factors 6 - 12 because they are not used in the interpretation and their exclusion (from the output) shortens the text.
Principal Component Factor Analysis of the Correlation Matrix
Unrotated Factor Loadings and Communalities
Variable |
Factor1 |
Factor2 |
Factor3 |
Factor4 |
Factor5 |
Communality |
|---|---|---|---|---|---|---|
MaxAlt |
0.8780 |
0.0780 |
-0.1950 |
-0.3720 |
-0.104 |
1.0 |
MeanAlt |
0.7690 |
-0.1620 |
0.0250 |
-0.4990 |
-0.144 |
1.0 |
SDAlt |
0.8290 |
0.2750 |
-0.3550 |
-0.0960 |
0.040 |
1.0 |
MeanSlope |
0.7710 |
0.2900 |
-0.3720 |
-0.0430 |
0.255 |
1.0 |
Mire |
-0.5060 |
-0.2280 |
0.1530 |
-0.5950 |
-0.247 |
1.0 |
Heathland |
0.7040 |
-0.1170 |
0.0950 |
0.3530 |
-0.033 |
1.0 |
WetHeath |
-0.2280 |
0.4600 |
-0.1280 |
0.0280 |
-0.743 |
1.0 |
Deer |
0.7030 |
0.1030 |
0.2490 |
0.2630 |
-0.317 |
1.0 |
Sheep |
-0.4610 |
-0.5420 |
-0.5780 |
-0.1610 |
0.050 |
1.0 |
Cattle |
0.2130 |
-0.9140 |
-0.1040 |
0.1160 |
-0.119 |
1.0 |
NPP |
-0.4230 |
0.1420 |
-0.6850 |
0.2870 |
-0.199 |
1.0 |
Grazed |
0.5210 |
-0.7520 |
0.0090 |
0.2260 |
-0.214 |
1.0 |
Variance |
4.6505 |
2.1944 |
1.2284 |
1.1201 |
0.915 |
|
% Var |
0.3880 |
0.1830 |
0.1020 |
0.0930 |
0.076 |
Rotated Factor Loadings and Communalities
Varimax Rotation
Variable |
Factor1 |
Factor2 |
Factor3 |
Factor4 |
Factor5 |
|---|---|---|---|---|---|
MaxAlt |
0.6740 |
-0.1110 |
-0.6480 |
0.1220 |
0.0530 |
MeanAlt |
0.3400 |
-0.1990 |
-0.8640 |
0.2190 |
-0.0400 |
SDAlt |
0.8880 |
-0.0210 |
-0.2460 |
0.0100 |
0.1650 |
MeanSlope |
0.8930 |
0.0300 |
-0.1570 |
0.0320 |
0.2500 |
Mire |
-0.2780 |
0.0540 |
-0.0180 |
-0.0180 |
-0.9380 |
Heathland |
0.2560 |
-0.2070 |
-0.1220 |
0.0880 |
0.1480 |
WetHeath |
-0.0400 |
0.1660 |
0.0430 |
-0.1010 |
-0.0060 |
Deer |
0.2140 |
-0.1150 |
-0.2070 |
0.0340 |
0.1160 |
Sheep |
-0.1540 |
-0.2100 |
0.0610 |
-0.2450 |
-0.1550 |
Cattle |
-0.0390 |
-0.9480 |
-0.0530 |
0.0790 |
-0.0140 |
NPP |
-0.0430 |
0.1100 |
0.1830 |
-0.9480 |
-0.0170 |
Grazed |
0.0770 |
-0.9200 |
-0.1750 |
0.0580 |
0.0850 |
Variance |
2.3801 |
1.9408 |
1.3825 |
1.0519 |
1.0402 |
%Var |
0.1980 |
0.1620 |
0.1150 |
0.0880 |
0.0870 |
1 |
Loading Plot
 [D]
[D]Factor Score Coefficients: These have been deleted from the output.
Analysis 2: Factor analysis extracting 4 components (eigen values >1) with a rotated solution.
Principal Component Factor Analysis of the Correlation Matrix
Unrotated Factor Loadings and Communalities
Variable |
Factor1 |
Factor2 |
Factor3 |
Factor4 |
Communality |
|---|---|---|---|---|---|
MaxAlt |
0.8780 |
0.0780 |
-0.1950 |
-0.3720 |
0.954 |
MeanAlt |
0.7690 |
-0.1620 |
0.0250 |
-0.4990 |
0.868 |
SDAlt |
0.8290 |
0.2750 |
-0.3550 |
-0.0960 |
0.898 |
MeanSlope |
0.7710 |
0.2900 |
-0.3720 |
-0.0430 |
0.819 |
Mire |
-0.5060 |
-0.2280 |
0.1530 |
-0.5950 |
0.687 |
Heathland |
0.7040 |
-0.1170 |
0.0950 |
0.3530 |
0.643 |
WetHeath |
-0.2280 |
0.4600 |
-0.1280 |
0.0280 |
0.281 |
Deer |
0.7030 |
0.1030 |
0.2490 |
0.2630 |
0.636 |
Sheep |
-0.4610 |
-0.5420 |
-0.5780 |
-0.1610 |
0.866 |
Cattle |
0.2130 |
-0.9140 |
-0.1040 |
0.1160 |
0.905 |
NPP |
-0.4230 |
0.1420 |
-0.6850 |
0.2870 |
0.751 |
Grazed |
0.5210 |
-0.7520 |
0.0090 |
0.2260 |
0.887 |
Variance |
4.6505 |
2.1944 |
1.2284 |
1.1201 |
9.193 |
% Var |
0.3880 |
0.1830 |
0.1020 |
0.0930 |
0.766 |
Rotated Factor Loadings and Communalities
Varimax Rotation
Variable |
Factor1 |
Factor2 |
Factor3 |
Factor4 |
|---|---|---|---|---|
MaxAlt |
0.929 |
-0.1360 |
0.1560 |
0.2180 |
MeanAlt |
0.775 |
-0.3200 |
-0.0510 |
0.4030 |
SDAlt |
0.860 |
0.0350 |
0.3960 |
-0.0080 |
MeanSlope |
0.801 |
0.0600 |
0.4130 |
-0.0570 |
Mire |
-0.189 |
-0.0090 |
-0.7960 |
0.1280 |
Heathland |
0.289 |
-0.3490 |
0.6280 |
0.2080 |
WetHeath |
-0.050 |
0.4990 |
0.0110 |
-0.1700 |
Deer |
0.303 |
-0.1280 |
0.6160 |
0.3840 |
Sheep |
-0.106 |
-0.3710 |
-0.5330 |
-0.6570 |
Cattle |
-0.008 |
-0.9440 |
-0.0250 |
-0.1120 |
NPP |
-0.136 |
0.2210 |
0.0150 |
-0.8270 |
Grazed |
0.145 |
-0.8880 |
0.2700 |
0.0680 |
Variance |
3.110 |
2.3799 |
2.1217 |
1.5818 |
% Var |
0.259 |
0.1980 |
0.1770 |
0.1320 |
Loading Plot
 [D]
[D]
2 |
Interpreting the loadingsDecide which statements are valid. |
Factor Score Coefficients: Not shown
Analysis 3: Factor analysis extracting 5 components with a rotated solution.
Principal Component Factor Analysis of the Correlation Matrix
Unrotated Factor Loadings and Communalities
Variable |
Factor1 |
Factor2 |
Factor3 |
Factor4 |
Factor5 |
Communality |
|---|---|---|---|---|---|---|
MaxAlt |
0.8780 |
0.0780 |
-0.1950 |
-0.3720 |
-0.104 |
0.9640 |
MeanAlt |
0.7690 |
-0.1620 |
0.0250 |
-0.4990 |
-0.144 |
0.8890 |
SDAlt |
0.8290 |
0.2750 |
-0.3550 |
-0.0960 |
0.040 |
0.8990 |
MeanSlope |
0.7710 |
0.2900 |
-0.3720 |
-0.0430 |
0.255 |
0.8840 |
Mire |
-0.5060 |
-0.2280 |
0.1530 |
-0.5950 |
-0.247 |
0.7470 |
Heathland |
0.7040 |
-0.1170 |
0.0950 |
0.3530 |
-0.033 |
0.6440 |
WetHeath |
-0.2280 |
0.4600 |
-0.1280 |
0.0280 |
-0.743 |
0.8330 |
Deer |
0.7030 |
0.1030 |
0.2490 |
0.2630 |
-0.317 |
0.7360 |
Sheep |
-0.4610 |
-0.5420 |
-0.5780 |
-0.1610 |
0.050 |
0.8680 |
Cattle |
0.2130 |
-0.9140 |
-0.1040 |
0.1160 |
-0.119 |
0.9190 |
NPP |
-0.4230 |
0.1420 |
-0.6850 |
0.2870 |
-0.199 |
0.7910 |
Grazed |
0.5210 |
-0.7520 |
0.0090 |
0.2260 |
-0.214 |
0.9330 |
Variance |
4.6505 |
2.1944 |
1.2284 |
1.1201 |
0.915 |
10.1084 |
% Var |
0.3880 |
0.1830 |
0.1020 |
0.0930 |
0.076 |
0.8420 |
Rotated Factor Loadings and Communalities
Varimax Rotation
Variable |
Factor1 |
Factor2 |
Factor3 |
Factor4 |
Factor5 |
|---|---|---|---|---|---|
MaxAlt |
0.9420 |
-0.1530 |
0.2110 |
0.0950 |
-0.0140 |
MeanAlt |
0.8070 |
-0.3100 |
0.3230 |
-0.1730 |
0.0830 |
SDAlt |
0.8480 |
0.0150 |
0.0660 |
0.4180 |
-0.0310 |
MeanSlope |
0.7780 |
0.1050 |
-0.0010 |
0.4980 |
0.1410 |
Mire |
-0.1580 |
0.0100 |
-0.0790 |
-0.8440 |
-0.0670 |
Heathland |
0.2950 |
-0.4030 |
0.3550 |
0.5170 |
0.0380 |
WetHeath |
-0.0410 |
0.2160 |
-0.0160 |
-0.1050 |
-0.8800 |
Deer |
0.3260 |
-0.2830 |
0.5700 |
0.4000 |
-0.2540 |
Sheep |
-0.1290 |
-0.2860 |
-0.8040 |
-0.3310 |
0.1180 |
Cattle |
0.0060 |
-0.9230 |
-0.1540 |
-0.0680 |
0.1980 |
NPP |
-0.1780 |
0.1120 |
-0.7220 |
0.1900 |
-0.4340 |
Grazed |
0.1660 |
-0.9300 |
0.1140 |
0.1450 |
0.0870 |
Variance |
3.1584 |
2.2293 |
1.8167 |
1.7826 |
1.1215 |
%Var |
0.2630 |
0.1860 |
0.1510 |
0.1490 |
0.0930 |
Loading Plot
 [D]
[D]
3 |
Factor NamesMatch the potential factor names to the factor numbers. |
Factor Score Coefficients: Not shown