Casewise Interpretation
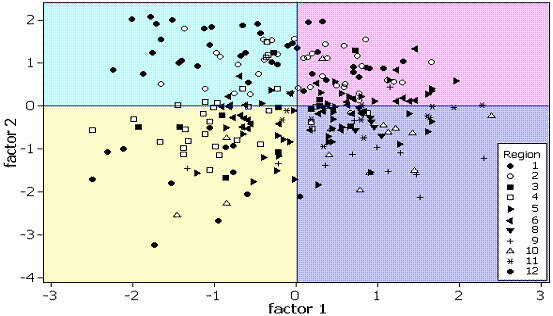
This analysis has a rotated solution and extracts 5 factors (as in the previous example 3).In the following plot cases are labelled by their region.
 [D]
[D]The following table is count of the number of cases, for each region, which are above and below 0 (above and below the factor means).
Region |
Factor 1 |
Factor 1 |
Factor 2 |
Factor 2 |
|---|---|---|---|---|
1 |
26 |
13 |
2 |
37 |
2 |
14 |
22 |
1 |
35 |
3 |
7 |
5 |
8 |
4 |
4 |
26 |
4 |
22 |
8 |
5 |
14 |
26 |
26 |
14 |
6 |
15 |
21 |
20 |
16 |
8 |
1 |
6 |
6 |
1 |
9 |
3 |
11 |
13 |
1 |
10 |
3 |
11 |
13 |
1 |
11 |
2 |
11 |
11 |
2 |
12 |
9 |
2 |
10 |
1 |
The rotated loadings are shown below. All absolute loadings < 0.3 have been blanked to ease interpretation.
Variable |
Factor1 |
Factor2 |
Factor3 |
Factor4 |
Factor5 |
|---|---|---|---|---|---|
MaxAlt |
0.942 |
||||
MeanAlt |
0.807 |
-0.310 |
0.323 |
||
SDAlt |
0.848 |
0.418 |
|||
MeanSlope |
0.778 |
0.498 |
|||
Mire |
-0.844 |
||||
Heathland |
-0.403 |
0.355 |
0.517 |
||
WetHeath |
-0.880 |
||||
Deer |
0.326 |
0.570 |
0.400 |
||
Sheep |
-0.804 |
-0.331 |
|||
Cattle |
-0.923 |
||||
NPP |
-0.722 |
-0.434 |
|||
Grazed |
-0.930 |
||||
1 |