This is the same analysis as the previous PCA, (four components extarcted) but the extracted factors are subjected to a Varimax rotation. In addition the rotated loadings have been sorted and set to 0 (if < 0.2) to ease the interpretation.
Principal Component Factor Analysis of the Correlation Matrix

Rotated Factor Loadings and Communalities
Varimax Rotation

Variable  Factor1  Factor2  Factor3  Factor4  Communality
LUNGES      0.921   -0.118    0.096   -0.082        0.878
BITES       0.868   -0.107   -0.331    0.000        0.875
ZIGZAGS    -0.066    0.100   -0.064    0.965        0.951
NEST       -0.011    0.784    0.092    0.395        0.780
SPINES      0.167   -0.069   -0.901    0.049        0.848
DNEST      -0.110    0.854    0.072   -0.074        0.752
BOUT        0.270   -0.535    0.406   -0.038        0.525

Variance   1.7199   1.6698   1.1137   1.1043       5.6076
% Var       0.246    0.239    0.159    0.158        0.801

Sorted Rotated Factor Loadings and Communalities

Variable  Factor1  Factor2  Factor3  Factor4  Communality
LUNGES      0.921*   0.000    0.000    0.000       0.878
BITES       0.868*   0.000   -0.331*   0.000       0.875
DNEST       0.000    0.854*   0.000    0.000       0.752
NEST        0.000    0.784*   0.000    0.395*      0.780
BOUT        0.270*  -0.535*   0.406*   0.000       0.525
SPINES      0.000    0.000   -0.901*   0.000       0.848
ZIGZAGS     0.000    0.000    0.000    0.965*      0.951

Variance   1.7199   1.6698   1.1137   1.1043       5.6076
% Var       0.246    0.239    0.159    0.158        0.801
The inital (not shown) component loading matrix is identical to the 4-component PCA. The important rotated loadings have been marked with an asterisk (by me) to highlight the patterns.
We now have a much simpler, and more clearly delineated pattern of loadings.
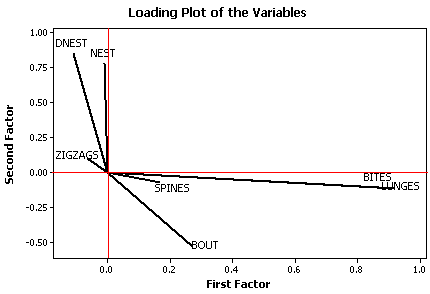
1. Lunges, Bites & Bouts: may be interpreted as 'Aggression' 2. Nest, Dnest & Bouts (negative): may be interpreted as 'Nest Activity' 3. Bites, Spines & Bouts (negative): a different type of 'Aggression 4. Zigzags & Nest: female-centered display
The loadings on the first two factors are also clear from the loading plot. The first factor (horizontal) is obviously mainly BITES and LUNGES. BOUT also has a moderate loading on this, and the second, factor. Factor two is mainly the nest building variables: DNEST and NEST.

This is a much more successful analysis, in which the dimensionality has been reduced from seven to four and the extracted factors can be interpreted to produce a biologically reasonable interpretation.
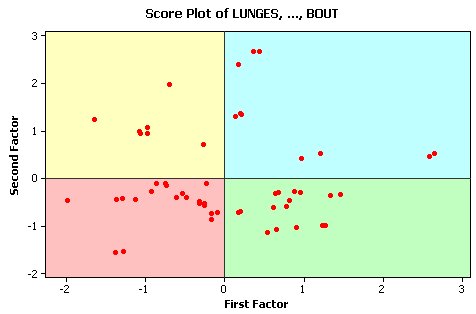
The following plot shows the scores for the cases on the first two of the new components: 'Aggression' and 'Nest Activity'. The plot has been split into 4 sections using shading. The boundaries are at 0 on both axes.

1. Pale yellow: below average Factor 1 and above average F2. Thus, these individuals did not show much aggression but spent a lot of time on nest building activities. 2. Pale blue: above average on both axes. Thus, they combine above average aggression with a lot of nest building activities. Note the lack of points along the diagonal, why?(think about what the fish would have to do to get on the diagonal) 3. Pale pink: below average on both axes. These individuals didn't do much! 4. Pale green: above average on factor 1 and below average of factor 2. These individuals did not spend much time on nest building but were above average with respect to aggression.