PCA Example 3: Stickleback behaviour
Descriptive Statistics
| |
Minimum |
Maximum |
Mean |
Std. Dev. |
| LUNGES |
41 |
277 |
131.19 |
50.77 |
| BITES |
3 |
175 |
69.06 |
43.43 |
| ZIGZAGS |
0 |
26 |
7.28 |
6.69 |
| NEST |
0 |
15 |
1.43 |
3.00 |
| SPINES |
5 |
46 |
18.43 |
8.71 |
| DNEST |
0 |
199 |
34.26 |
56.49 |
| BOUT |
6 |
306 |
89.31 |
98.68 |
Correlations
|
LUNGES
|
BITES |
ZIGZAGS |
NEST |
SPINES |
DNEST |
| BITES |
0.688 |
| ZIGZAGS |
-0.139 |
-0.043 |
| NEST |
-0.164 |
-0.149 |
0.352 |
| SPINES |
0.056 |
0.373 |
0.068 |
-0.053 |
| DNEST |
-0.229 |
-0.218 |
0.091 |
0.514 |
-0.051 |
| BOUT |
0.233 |
0.117 |
-0.161 |
-0.306 |
-0.041 |
-0.242 |
| significant correlations
shaded yellow |
|
 |
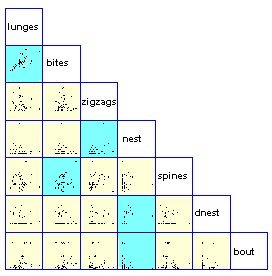
Note the pattern of correlations, shaded blue in the scatter
plot. In particular, bites and lunges are quite highly correlated. Consider
the other significant correlations, do they look like artefacts or possible
spurious correlations?
On to the first analysis.
Back to PCA Example 3 menu.


