Factor Analysis
In this analysis all five variables are subjected to a PCA (SPSS Factor Analysis). Five components are extracted and there is no rotation of the axes. Factor scores have been saved.
Because all five components (same as the number of variables) are extracted the communalities are 1.0.
| Initial | Extraction | |
|---|---|---|
| AGE | 1.000 | 1.000 |
| creatine kinase | 1.000 | 1.000 |
| hemopexin | 1.000 | 1.000 |
| lactate dehydrogenase | 1.000 | 1.000 |
| pyruvate kinase | 1.000 | 1.000 |
| Extraction Method: Principal Component Analysis. | ||
| Initial Eigenvalues | Extraction Sums of Squared Loadings | |||||
|---|---|---|---|---|---|---|
| Component | Total | % of Variance | Cumulative % | Total | % of Variance | Cumulative % |
| 1 | 2.576 | 51.515 | 51.515 | 2.576 | 51.515 | 51.515 |
| 2 | 1.189 | 23.779 | 75.295 | 1.189 | 23.779 | 75.295 |
| 3 | .630 | 12.594 | 87.889 | .630 | 12.594 | 87.889 |
| 4 | .445 | 8.909 | 96.798 | .445 | 8.909 | 96.798 |
| 5 | .160 | 3.202 | 100.000 | .160 | 3.202 | 100.000 |
| Extraction Method: Principal Component Analysis. | ||||||
The analysis seems to be potentially useful because 75% of the variability is retained by the first two components. In other words the dimensionality of the data is somewhat less than the original 5.
Because there is a large decrease in the value of the 3rd eigen value, and only the first two have eigen values > 1.0, we will concentrate on these two components. The other three sets of loadings have been 'grayed out' to help in the interpretation.
| Component | |||||
|---|---|---|---|---|---|
| 1 | 2 | 3 | 4 | 5 | |
| AGE | 0.402 | 0.739 | 0.536 | 0.048 | 0.051 |
| creatine kinase | 0.851 | -0.325 | 0.141 | 0.290 | -0.256 |
| hemopexin | 0.525 | 0.611 | -0.564 | 0.181 | -0.001 |
| lactate dehydrogenase | 0.857 | -0.405 | 0.014 | 0.116 | 0.296 |
| pyruvate kinase | 0.824 | 0.008 | -0.061 | -0.559 | -0.068 |
| Extraction Method: Principal Component Analysis. | |||||
| a 5 components extracted. | |||||
All five variables are loaded onto the first component. This is not uncommon in a PCA. It is a measure of the overall variability. Traditionally the first component is viewed as a 'size' or 'magnitude' component. The second component is everything except pyruvate kinase. However, the four variables are split into two groups.
- Age and hemopexin: they have positive loadings (correlations), hence large scores on component 2 tend to be associated with larger values for age and hemopexin.
- Lactate dehydrogenase and creatine kinase: they have negative loadings (correlations), hence large scores on component 2 tend to be associated with smaller values for lactate dehydrogenase and creatine kinase.
Go back to the data description and examine the correlation coefficients. How do these relate to the structure of PC1 & PC2?
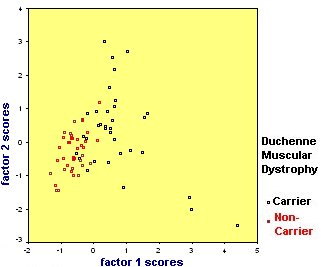
Now we will see what, if anything, the component scores tell us about the differences between carriers and non-carriers.

Several things are apparent from this plot.
- There is some separation of the two groups
- Carriers tend to have larger values for PC1 & PC2. How do these relate to the original variables (Hint look at the loadings).
- The carriers are much more heterogeneous, with some obvious outliers.