PCA Example 2: Duchenne Muscular Dystrophy
| N | Minimum | Maximum | Mean | Std. Deviation | |
|---|---|---|---|---|---|
| age | 73 | 20 | 59 | 30.82 | 7.95 |
| creatine kinase | 73 | 15.0 | 657.0 | 95.479 | 123.162 |
| hemopexin | 73 | 53.0 | 118.0 | 86.319 | 13.658 |
| lactate dehydrogenase | 73 | 3.5 | 110.0 | 18.933 | 15.982 |
| pyruvate kinase | 73 | 87.0 | 412.0 | 203.411 | 68.269 |
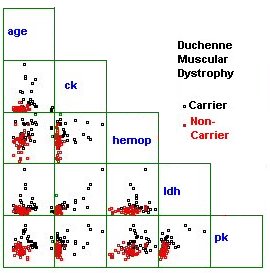
Matrix of scatter plots, with cases marked by carrier status

The next table shows the correlation coefficients (and p values) for the pairs of variables. Significant correlations are marked with one or more asterisks.
Note the pattern of correlations. In particular, pyruvate kinase is significantly correlated with all other variables. Think about how this might impact on the subsquent PCA.
| age | creatine kinase | hemopexin | lactate dehydrogenase | |||
|---|---|---|---|---|---|---|
| creatine kinase | r | 0.178 | ||||
| p | 0.132 | |||||
| hemopexin | r | **0.368 | 0.222 | |||
| p | 0.001 | 0.059 | ||||
| lactate dehydrogenase | r | 0.073 | **0.821 | 0.216 | ||
| p | 0.540 | 0.000 | 0.067 | |||
| pyruvate kinase | r | *0.274 | **0.545 | **0.371 | **0.617 | |
| p | 0.019 | 0.000 | 0.001 | 0.000 | ||
| * Correlation is significant at the 0.05 level (2-tailed) .** Correlation is significant at the 0.01 level (2-tailed). | ||||||