Factor Analysis of Duchenne Muscular Dystrophy Data 2
Because we are going to extract five components the communalities are 1.0. Factor scores have been saved.
| Initial | Extraction | |
|---|---|---|
| age | 1.000 | 1.000 |
| creatine kinase | 1.000 | 1.000 |
| hemopexin | 1.000 | 1.000 |
| lactate dehydrogenase | 1.000 | 1.000 |
| pyruvate kinase | 1.000 | 1.000 |
| Extraction Method: Principal Component Analysis. | ||
Five components are extracted and this time the axes are rotated. The initial eigen values and Extraction Sums of Squared Loadings are identical to the previous analysis. However, because we have now asked for axis rotation we are provided with additional information about the Rotation Sum of Squared loadings.
| Initial Eigenvalues | Extraction Sums of Squared Loadings | Rotation Sums of Squared Loadings | |||||||
|---|---|---|---|---|---|---|---|---|---|
| Component | Total | % Variance | Cumulative % | Total | % Variance | Cumulative % | Total | % Variance | Cumulative % |
| 1 | 2.576 | 51.515 | 51.515 | 2.576 | 51.515 | 51.515 | 1.705 | 34.100 | 34.100 |
| 2 | 1.189 | 23.779 | 75.295 | 1.189 | 23.779 | 75.295 | 1.023 | 20.454 | 54.553 |
| 3 | .630 | 12.594 | 87.889 | .630 | 12.594 | 87.889 | 1.014 | 20.280 | 74.834 |
| 4 | .445 | 8.909 | 96.798 | .445 | 8.909 | 96.798 | 1.013 | 20.262 | 95.096 |
| 5 | .160 | 3.202 | 100.000 | .160 | 3.202 | 100.000 | .245 | 4.904 | 100.000 |
| Extraction Method: Principal Component Analysis. | |||||||||
Examining the rotated factor loadings (below) it is apparent that the first component is almost entirely creatine kinase and lactate dehydrogenase (plus some pyruvate kinase). The second component is almost entirely pyruvate kinase. If we wished to look further factor three is an age factor and factor four is hemopexin.
| Component | |||||
|---|---|---|---|---|---|
| 1 | 2 | 3 | 4 | 5 | |
| age | 0.053 | 0.105 | 0.977 | 0.176 | -0.003 |
| creatine kinase | 0.965 | 0.218 | 0.090 | 0.087 | -0.070 |
| hemopexin | 0.093 | 0.153 | 0.182 | 0.967 | 0.022 |
| lactate dehydrogenase | 0.806 | 0.328 | -0.018 | 0.086 | 0.484 |
| pyruvate kinase | 0.335 | 0.913 | 0.131 | 0.181 | 0.071 |
| Extraction Method: Principal
Component Analysis. Rotation Method: Varimax with Kaiser Normalization. |
|||||
| a Rotation converged in 6 iterations. | |||||
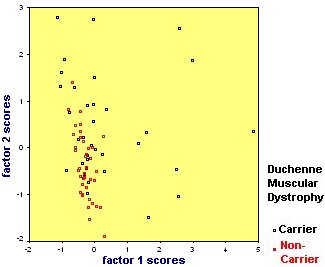
Again we have plotted the factor scores and overlaid the plot with information about carrier status.

This time the plot shows that there is a lot of overlap between the two groups. As before the carriers are more heterogeneous, especially on factor 1. What the analysis tells us is that carriers are not characterised by one set of enzyme values, it may be that carriers are composed of different types.