Analysis 1a: No criteria set and the tree is pruned
Before beginning make sure that the following options are set on the UserInput sheet. Later examples will investigate the consequences of other choices for these options.
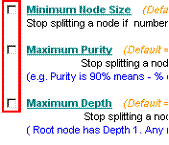
Leaf Node Criteria - Make sure that none are ticked, so that none apply (see region highlighted by red box).
Tree pruning and test set options
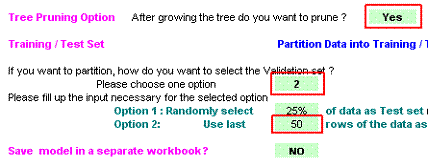
Make sure that the Tree Pruning option is set to Yes.
If you click on the cell with Yes a drop down menu will appearThe data should be partitioned using method 2 (use the drop down menu from the cell). The consequences of choosing option 1 will be explored later.
Partitioning method 2 uses the number of rows specified by the option 2 choice cell. In the example it is set at 50. Make sure that yours also says 50. This means that the first 200 cases (the training set) will be used to develop the tree. The tree will then be applied to last 50 cases (the test set) to get an indication of how well it will work with data collected in the future. There is no drop down menu for this cell, you will have to type in a number AND press the Enter key.
You begin the analysis by clicking on the Build Tree button on the UserInput sheet.
If nothing happens it may be because you have forgotten to press Enter after changing an option value.
The program may take 10-20 seconds to complete the tree building, after which the Results sheet will be displayed.
Results for Analysis 1a
Your results screen should look like this. I have added three boxes (Regions 1, 2 & 3) to simply a description of the output.
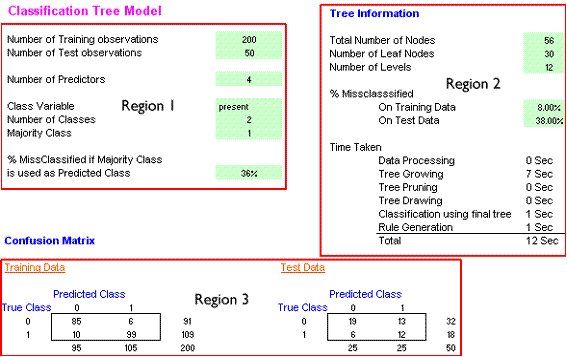
Region 1 of the Results sheet gives some basic information about the data. There are 250 cases, split between 200 training and 50 test cases. There are 4 predictors (vegetation, slope, water and aspect). The name of the Class Variable is 'present', this is the name in the P23 cell on the Data sheet. There are two classes and most of them (127 out 250) belong to class 1. Class 1 is therefore the majority class. The final section gives a figure of 36% misclassified. This figure comes from the test data (the last 50 cases). There are 18 class 1 and 32 class 0 cases in the test data. Therefore, the majority class here is class 0. If all of the test cases were labelled as 0 this would mean that 18 class 1 cases would be misclassified as class 0. 18/50 = 36%.
Region 2 gives details about the tree. The important part is at the top, the lower part just gives the timings for different parts of the analysis. There are 56 nodes in the tree and 30 leaf (terminal) nodes. The tree has 11 layers, this means that you would need to pass through 11 nodes to get to some leaf nodes. This tree does very well with the training data, only 8% (16 ) cases are given the wrong label. Unfortunately, 38% of the test cases are given the wrong label. The details of these misclassifications are given in section 3 - the confusion matrices.
Region 3 has two confusion matrices, one each for the training and test data. The training matrix shows that 200 cases were classified, of which 91 had a true class of 0 and 109 had a true class of 0. 95 of the 200 cases were predicted to have a class of 0 and 105 to have a class of 1. Of those predicted to be class 0, 85 were correctly placed and 10 were incorrectly placed. Similarly, of the 105 predicted to be class 1, 99 were correctly identified and 6 were misclassified.
1 |
Analysis 1a: Test data confusion matrixMatch these elements of the confusion matrix to the correct number. |
The Analysis 1a tree
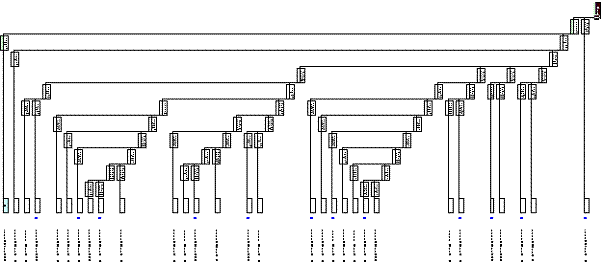
The tree is far too large to display on one screen. The following was captured from the Excel page displayed at 10% zoom. Although details cannot be seen it does show the overall structure. This image has been rotated through 90 degrees.
The top left hand part of the tree is shown below.
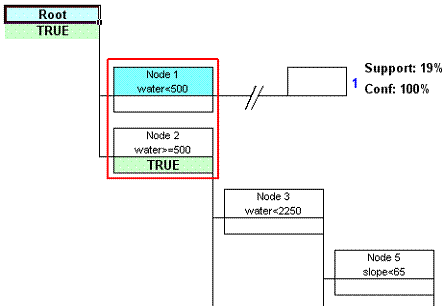
This image of the tree has been edited for interpretative purposes. The Node 1 box has been coloured blue to highlight it and the horizontal line from node 1 has been drastically shortened to show the leaf node details (support and confidence). This part of the tree shows that cases in the root node are split by a rule which uses a distance to water threshold.
2 |
What is true about cases in Node 2? |
If you click on Node 1 in the tree and then on the View Node button at the top left of the tree sheet you will be given details of the cases for which this rule is true, i.e. they are all less than 500 m from water.
The View Node sheet informs us that this is Node 1 (others can be viewed using the up/down arrows). It is a leaf node and has 38 records (cases), which is 19% of the total (38/200 = 19%). The majority class is the second class, presence = 1 and all 38 cases are class 1 so there are no misclassifications. The pie chart shows that 100% of the cases are class 1.
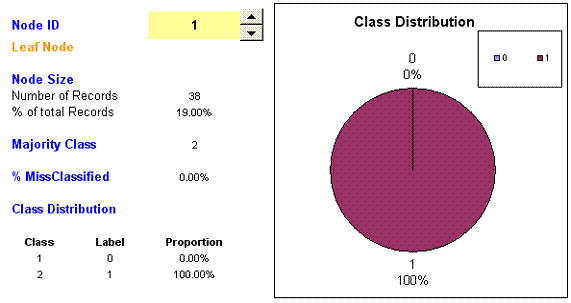
If you follow the horizontal line to right from Node 1 it eventually takes you to a box which is labelled 1, i.e. cases are predicted to be presence = 1. The support is 19% (19% of the cases) and the confidence is 100 % (because no cases are misclassified).
3 |
No further interpretation will be made on this tree due to its complexity. The next sections explore some of the analysis options.
