Analysis 1b: Exploring options

First analysis

This is a repeat of the previous except that you should turn off Tree Pruning on the UserInput sheet. Do not change anything else.

Turn off tree pruning option

First a reminder of the Results from the previous analysis. The previous image is shown followed by a short description of the tree and misclassification information.
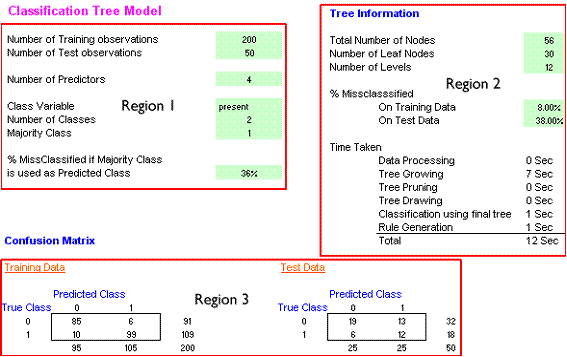
Screen shot of the results page after the stage 1a analysis. Details are described in the next section.

There are 56 nodes in the tree and 30 leaf (terminal) nodes. The tree has 11 layers. 8% of training cases are given the wrong label. 38% of the test cases are given the wrong label.

The training confusion matrix shows that 200 cases were classified, of which 91 had a true class of 0 and 109 had a true class of 0. 95 of the 200 cases were predicted to have a class of 0 and 105 to have a class of 1. Of those predicted to be class 0, 85 were correctly placed and 10 were incorrectly placed. Similarly, of the 105 predicted to be class 1, 99 were correctly identified and 6 were misclassified.

1

Comparing the pruned and unpruned trees

Decide which statements are corect, there can be more than one.

a) The number of cases in the training and test groups has not changed
b) The performance is better with training cases
c) The tree depth has increased by 3.
d) The number of leaf nodes is now 82
e) The number of correctly classified cases is larger in the training data for both presence and absence locations.
f) The tree is showing evidence of over-training.
a) Correcta) If they have changed you must have made some other alterations on the UserInput page.b) It is the same (8% incorrect)b) It is the same (8% incorrect)c) Correctc) It was 12 and is now 15.d) It is 44d) It was 30, and is now 44. 82 is the number of nodes.e) It is correct for absences but incorrect for presencese) The number of correct absences increased from 85 to 87 but the number of presences decreased from 99 to 97.f) Correctf) This is incorrect because the percentage of test cases incorrectly identified has risen from 38% to 40%
Check your answer

Second Analysis

Turn tree pruning back on. What are the consequences of using the first training / test option: use randomly selected rows?

On the UserInput sheet use the drop down menu to change the option to 1.

Drop down menu to change test data option

Also change the Option 1 to 25% of cases - this means that approximately 62 cases (250 x 0.25) will be retained for testing. The remainder will be used for testing. The screen should look like this.

Test data options set: Method 1 with 25% of cases

Now run the same analysis three or four times and keep a note of the tree information on the Results sheet.

2

Using randomly selected test cases

Fill in the gaps from the drop down menus.

Using selected training cases altered the tree structure. All of the tree descriptors: node number, depth and accuracy, between runs. This variation arose because cases contributed to the test and training cases. The effect was greatest on the of the test cases. Using randomly selected cases also had some effects on the tree .

Using randomly selected training cases altered the tree structure. All of the tree descriptors: node number, depth and accuracy, varied between runs. This variation arose because different cases contributed to the test and training cases. The effect was greatest on the accuracy of the test cases. Using randomly selected cases also had some effects on the tree structure.

Using randomly selected training cases altered the tree structure. All of the tree descriptors: node number, depth and accuracy, varied between runs. This variation arose because different cases contributed to the test and training cases. The effect was greatest on the accuracy of the test cases. Using randomly selected cases also had some effects on the tree structure.

Because different cases are used for training the differences between the classes will not be consistent. Although the differences are generally small, they are sometimes large. Although this may seem like a major flaw recall that 'normal' statistics assume that samples were obtained randomly and there will be differences between different samples.

One unfortunate consequence of this variation for computer marked assessments is that it is impossible to predict or control the answers. Therefore, all SAQs assume that the fixed test set method is used.
Check your answer

What are the effects of controlling the tree depth?

Make sure that

Run the analysis with tree depth constraints of 4, 5, 6 and 7. You do this on the UserInput sheet, see below.

Maximum depth ticked and maximum depth set at 6

Make sure that the Maximum Depth option is ticked (but no others) and that the depth is either 4, 5, 6 or 7. You need to type the depth into this cell and press the Enter key to finalise this. Also build the tree with this option turned off, i.e. the tree is allowed to grow to its maximum pruned depth. Build the trees and make a note of the following from the results page.

Total Number of Nodes

Number of Leaf Nodes

Number of Levels

% Missclasssified

On Training Data

On Test Data

3

Best tree for training data

Which tree depth produced the most accurate tree with training data?

a) 4
b) 5
c) 6
d) 7
e) 12, no maximum depth specified
Yes, the misclassification rate was only 8%, although it was 38% with the test data. The accuracy with the training data increased as the tree depth increased.The misclassification rate was only 8% for the tree with a depth of 15, although it was 38% with the test data. The accuracy with the training data increased as the tree depth increased.
Check your answer

4

Accuracy with test data

Which tree depth produced the most accurate results for the test data?

a) 4
b) 5
c) 6
d) 7
e) 12, no maximum set
Yes, the misclassification rate was 28%. Above and below this depth the rate was 38%.The lowest misclassification rate was 28% for a depth of 6. Above and below this depth the rate was 38%.
Check your answer

5

Comparing tree depths

One or more of the follwoing statements is correct.

a) The optimum tree depth for generalization is 6.
b) Accuracy was low with a small depth because mixed nodes were prevented from being split.
c) At the optimum tree depth there was little difference between the accuracy for training and test data.
d) The most accurate tree for training data performed no better than a simple majority rule with the test data
e) There were 11 leaf nodes in the optimum tree.
a) Correcta) The answer is 6 because this is the lowest test data misclassification rate (28%)b) Correctb) Yes, examine the node views for a depth of 4, many of the nodes are a mix of 0s & 1s.c) Correctc) True because the two misclassification rates were 23% and 28%.d) Correctd) True, because if all test cases are labelled with the majority case the misclassification rate was 36% compared with 38% for this tree.e) Correcte) Re-run the analysis with a maximum depth of 6, tree pruning and the last 50 rows for testing. You will see that there are 11 lef nodes.
Check your answer