Preliminaries

The aim of the exercise is to predict whether some mountain sheep are likely to be found at particular locations and which variables are implicated in their presence/absence. There are four potential predictors and one class variable.

Predictors

Vegetation: a measure of plant density (continuous variable)

Slope: slope of the land (degrees, continuous variable)

Water: distance to water (m, continuous variable)

Aspect: aspect of the land surface (a categorical variable), where 1 = E-NE, 2 = S-SE, 3 = W-SW and 4 = N-NW.

Class

Present (1 = sheep present, 0 = sheep absent)

Basic descriptive statistics

Variable    present    N    Mean  SE Mean  Minimum  Median   Maximum
vegetation  0        123   4.920    0.714  0.0000   0.600    45.400
            1        127   4.977    0.631  0.0000   1.400    31.400

slope       0        123   23.82    1.89   0.0000   15.00    85.00
            1        127   14.69    1.42   0.0000   15.00    85.00

water       0        123  1543.8    72.0   500.0    1250.0   3795.0
            1        127   869.3    50.2   25.0     875.0    2250.0 

1

Aspect descriptive statistics

Why have no descriptive statistics been presented for the aspect predictor?

a) Because aspect has no units.
b) Because it is an ordinal variable.
c) Because aspect is not a continuous variable.
d) Because aspect is not a ratio variable.
e) Because aspect is a categorical variable.
Aspect is a categorical variable and the numbers are simply labels. Remember that 1 = E-NE, 2 = S-SE, 3 = W-SW and 4 = N-NW. It does make sense to calculate descriptive statistics such as the mean and standard deviation. It is more important to have information on the relative frequencies for each aspect in locations where the sheep were found or were absent.
Check your answer

2

The best predictor

Which of the above seems to offer the greatest promise for discriminating between sheep locations?

a) Vegetation
b) Slope
c) Water
d) All are about the same
e) Not much to choose between slope and water
f) None of them
The means for vegetation appear very similar (4.92 & 4.98), so this has little promise. The ratio of the means (a measure of their difference after accounting for their magnitude) is similar for slope (23.82/14.69 = 1.62) and water (1543.3/869.3 = 1.77). The slightly larger value for water suggests this should be the best. This is reinforced by the reduced coefficient of variation for ware compared with slope. This implies that we should have greater confidence in the difference between the water means.The means for vegetation appear very similar (4.92 & 4.98), so this has little promise. The ratio of the means (a measure of their difference after accounting for their magnitude) is similar for slope (23.82/14.69 = 1.62) and water (1543.3/869.3 = 1.77). The slightly larger value for water suggests this should be the best. This is reinforced by the reduced coefficient of variation for ware compared with slope. This implies that we should have greater confidence in the difference between the water means.
Check your answer

The following table shows the frequencies for each aspect in locations with and without the sheep.

Rows: aspect   Columns: present

Aspect   0    1  All
1        6   23   29
2       22    8   30
3       21   23   44
4       74   73  147
All    123  127  250

3

Aspect as a predictor

Does the aspect variable have any merit as a predictor of sheep presence?

a) No
b) Yes
c) Possibly
Please select an answerCertainly aspects 3 & 4 show little promise but the differences for aspects 1 & 2 suggest one or both of these has some potential as a predictor of sheep presence.Certainly aspects 3 & 4 show little promise but the differences for aspects 1 & 2 suggest one or both of these has some potential as a predictor of sheep presence.Certainly aspects 3 & 4 show little promise but the differences for aspects 1 & 2 suggest one or both of these has some potential as a predictor of sheep presence.
Check your answer

4

Predictor dot plots

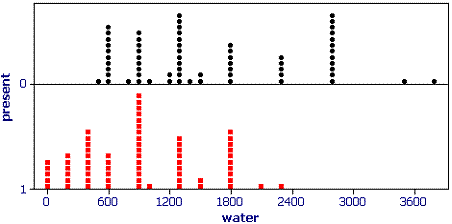
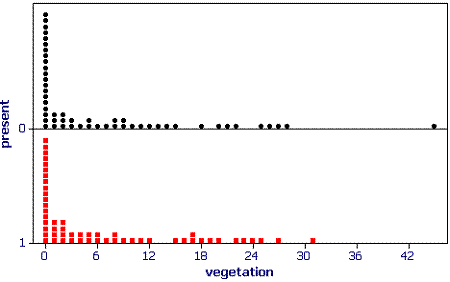
Examine the dot plots below (each dot is two cases). After examining these which variable do you think is likely to be the best predictor of sheep presence.
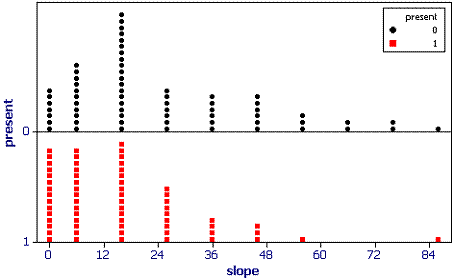
Dot plot of slope for presence and absence locations

Dot plot of water for presence and absence locations

Dot plot of vegetation for presence and absence locations

a) Vegetation
b) Water
c) Slope
Again vegetation shows little promise, the two distributions are very similar. Any cutpoint is likely to produce very similar frequencies for the two sheep presence classes.

It is less clear whether slope or water is the better predictor. A cut point of slope around 48 would produce a node with 16 0s and 4 1s. However, a cut point of water around 2300 would produce a node with only 2 0s and 38 1s. Also, a cut point of 500 m would separate off 42 of the absence locations. Therefore, distance to water remains the better predictor.

Check your answer