Exploratory Data Analyses
There are 252 cases and no missing values.
Descriptive statistics
Variable |
Mean |
SE |
Minimum |
Maximum |
|---|---|---|---|---|
MaxAlt |
677.7 |
16.4 |
102.0 |
1265.0 |
MeanAlt |
331.5 |
10.7 |
14.0 |
895.4 |
SDAlt |
131.4 |
3.34 |
13.6 |
255.7 |
MeanSlope |
13.6 |
0.286 |
2.92 |
26.97 |
Mire |
2.36 |
0.038 |
0.041 |
3.36 |
Heathland |
2.69 |
0.038 |
0.41 |
3.41 |
WetHeath |
1.51 |
0.041 |
0.04 |
2.84 |
Deer |
1.56 |
0.030 |
0.04 |
2.26 |
Sheep |
3.07 |
0.015 |
2.59 |
3.65 |
Cattle |
1.60 |
0.029 |
0.45 |
2.86 |
NPP |
6.56 |
0.007 |
6.29 |
6.89 |
Grazed |
5.05 |
0.022 |
4.16 |
5.99 |
Relationships between variables
In the matrix scatter plot the variable groups are marked in different colours.
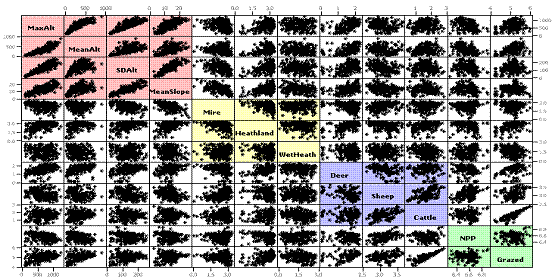 [D]
[D]Correlation Matrix
Correlation coefficients are significant (p<0.05, uncorrected for multiple testing) if the absolute value is >?????
Variable |
Max Alt |
Mean Alt |
SD Alt |
Mean Slope |
Mire |
Heath land |
Wet Heath |
Deer |
Sheep |
Cattle |
NPP |
|---|---|---|---|---|---|---|---|---|---|---|---|
MaxAlt |
0.86 |
0.84 |
0.73 |
-0.27 |
0.45 |
-0.08 |
0.50 |
-0.28 |
0.10 |
-0.30 |
|
MeanAlt |
0.86 |
0.55 |
0.47 |
-0.09 |
0.38 |
-0.18 |
0.46 |
-0.20 |
0.23 |
-0.43 |
|
SDAlt |
0.84 |
0.55 |
0.85 |
-0.45 |
0.48 |
-0.04 |
0.47 |
-0.33 |
-0.03 |
-0.13 |
|
MeanSlope |
0.73 |
0.47 |
0.85 |
-0.51 |
0.43 |
-0.14 |
0.37 |
-0.30 |
-0.06 |
-0.14 |
|
Mire |
-0.28 |
-0.09 |
-0.45 |
-0.51 |
-0.36 |
0.03 |
-0.32 |
0.33 |
-0.01 |
0.08 |
|
Heathland |
0.45 |
0.38 |
0.48 |
0.43 |
-0.36 |
-0.21 |
0.57 |
-0.30 |
0.22 |
-0.24 |
|
WetHeath |
-0.08 |
-0.18 |
-0.04 |
-0.14 |
0.03 |
-0.21 |
-0.06 |
-0.09 |
-0.29 |
0.23 |
|
Deer |
0.50 |
0.46 |
0.47 |
0.37 |
-0.32 |
0.57 |
-0.06 |
-0.52 |
0.02 |
-0.19 |
|
Sheep |
-0.28 |
-0.20 |
-0.33 |
-0.30 |
0.33 |
-0.30 |
-0.09 |
-0.52 |
0.39 |
0.40 |
|
Cattle |
0.10 |
0.23 |
-0.03 |
-0.06 |
-0.00 |
0.22 |
-0.29 |
0.02 |
0.39 |
-0.16 |
|
NPP |
-0.30 |
-0.43 |
-0.13 |
-0.14 |
0.08 |
-0.24 |
0.23 |
-0.19 |
0.40 |
-0.16 |
|
Grazed |
0.33 |
0.43 |
0.20 |
0.14 |
-0.20 |
0.45 |
-0.29 |
0.39 |
0.06 |
0.86 |
-0.23 |
1 |
CorrelationsWhich group of variables show the greatest internal correlation? |
2 |
Uncorrelated variablesWhich variables are relatively uncorrelated with the other variables? |
3 |
Preliminary interpretationsOne or more of the following statements is correct. |