Golden Eagle Core Areas: Stepwise Analysis
The default stepwise method (minimize Wilk's lambda) is used.
| Entered | Wilks' Lambda | ||||||||
|---|---|---|---|---|---|---|---|---|---|
| Statistic | df1 | df2 | df3 | Exact F | |||||
| Step | Statistic | df1 | df2 | p | |||||
| 1 | WET | 0.313 | 1 | 2 | 37.000 | 40.687 | 2 | 37 | 0.000 |
| 2 | LT200 | 0.108 | 2 | 2 | 37.000 | 36.810 | 4 | 72 | 0.000 |
| 3 | STEEP | 0.087 | 3 | 2 | 37.000 | 27.937 | 6 | 70 | 0.000 |
| At each step, the variable that minimizes the overall Wilks' Lambda is entered. | |||||||||
| a Maximum number of steps is 16. | |||||||||
| b Minimum partial F to enter is 3.84. | |||||||||
| c Maximum partial F to remove is 2.71. | |||||||||
| d F level, tolerance, or VIN insufficient for further computation. | |||||||||
| Step | Tolerance | F to Remove | Wilks' Lambda | |
|---|---|---|---|---|
| 1 | WET | 1.000 | 40.687 | |
| 2 | WET | .836 | 48.013 | 0.396 |
| LT200 | .836 | 34.167 | 0.313 | |
| 3 | WET | .815 | 15.506 | 0.164 |
| LT200 | .587 | 30.987 | 0.240 | |
| STEEP | .609 | 4.249 | 0.108 | |
Only three variables are entered: Wet, LT200 & Steep, giving 2 significant discriminant functions. Although the ideal number of predictors was 2 (cases to predictor ratio), 3 is much better than 8.
Summary of Canonical Discriminant Functions
| Function | Eigenvalue | % of Variance | Cumulative % | Canonical Correlation |
|---|---|---|---|---|
| 1 | 3.816(a) | 73.3 | 73.3 | 0.890 |
| 2 | 1.393(a) | 26.7 | 100.0 | 0.763 |
| a First 2 canonical discriminant functions were used in the analysis. | ||||
| Test of Function(s) | Wilks' Lambda | Chi-square | df | Sig. |
|---|---|---|---|---|
| 1 through 2 | 0.087 | 87.998 | 6 | 0.000 |
| 2 | 0.418 | 31.409 | 2 | 0.000 |
| Function | ||
|---|---|---|
| 1 | 2 | |
| WET | .0836 | -0.199 |
| STEEP | .0621 | -0.159 |
| LT200 | .0955 | 0.794 |
Using the structure matrix to interpret the differences suggests that:
- function 1 is mainly associated with large areas of wet heath and small areas of bog (negative correlation)
- function 2 is mainly associated with large areas of land below 200m and small areas of steep land, land between 400 & 600m and wet heath.
Indeed these are effectively the same axes obtained using all 8 predictors.
| Function | ||
|---|---|---|
| 1 | 2 | |
| WET | .674(*) | -.577 |
| BOG(a) | -.481(*) | -.269 |
| POST(a) | -.072(*) | -.037 |
| LT200 | .236 | .972(*) |
| STEEP | .339 | -.717(*) |
| L4_600(a) | .049 | -.568(*) |
| CALL(a) | -.250 | .290(*) |
| PRE(a) | .046 | .088(*) |
| Pooled within-groups correlations between
discriminating variables and standardized canonical discriminant functions Variables ordered by absolute size of correlation within function. |
||
| * Largest absolute correlation between each variable and any discriminant function | ||
| a This variable not used in the analysis. | ||
Since the axes are similar it is perhaps not too surprising that the separation is similar to the previous analysis.
| Function | ||
|---|---|---|
| REGION | 1 | 2 |
| 1.00 | -3.503 | -1.263 |
| 2.00 | 1.836 | -.838 |
| 3.00 | -.285 | 1.309 |
| Unstandardized canonical discriminant functions evaluated at group means | ||
Classification Statistics
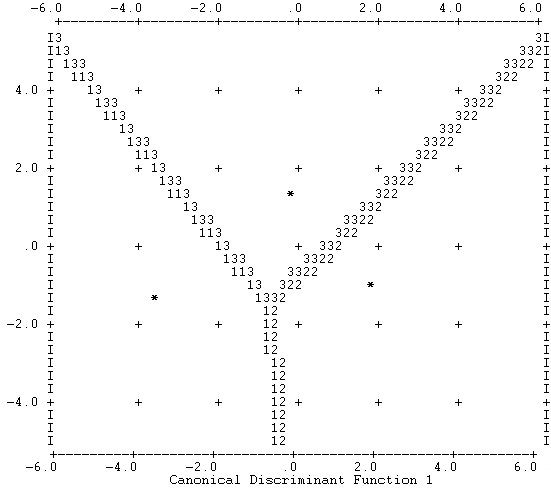
Territorial Map

Symbols used in territorial map
Symbol Group Label
------ ----- --------------------
1 1
2 2
3 3
* Indicates a group centroid
You may be suprised that the classification accuracy is better using fewer predictors! This is not as surprising as it sounds, it can happen when the extra predictors do not discriminate but introduce noise that 'clouds' the distinction between the groups.
| Predicted Group Membership | Total | |||||
|---|---|---|---|---|---|---|
| REGION | 1 | 2 | 3 | |||
| Original | Count | 1 | 7 | 0 | 0 | 7 |
| 2 | 0 | 14 | 2 | 16 | ||
| 3 | 0 | 0 | 17 | 17 | ||
| % | 1 | 100.0 | .0 | .0 | 100 | |
| 2 | .0 | 87.5 | 12.5 | 100 | ||
| 3 | .0 | .0 | 100.0 | 100 | ||
| Cross-validated(a) | Count | 1 | 7 | 0 | 0 | 7 |
| 2 | 0 | 14 | 2 | 16 | ||
| 3 | 0 | 0 | 17 | 17 | ||
| % | 1 | 100.0 | .0 | .0 | 100 | |
| 2 | .0 | 87.5 | 12.5 | 100 | ||
| 3 | .0 | .0 | 100.0 | 100 | ||
| a Cross validation is done only for those
cases in the analysis. In cross validation, each case is classified by the functions derived from all cases other than that case. |
||||||
| b 95.0% of original grouped cases correctly classified. | ||||||
| c 95.0% of cross-validated grouped cases correctly classified. | ||||||
Although this stepwise analysis has produced some promising results it can be criticised because it involved the rather unthinking application of a stepwise selection procedure. In the next example judgement is used to select the predictors.


