Example analysis
The process of building a decision tree is illustrated using a simple data set.
The data are the sex (M,F) of 30 adults. Data are available for the height (cm), weight (kg) and age (years). The aim is to build a tree that predicts the sex of a person from three predictors (height, weight and age).
sex |
height |
weight |
age |
|---|---|---|---|
F |
170 |
65 |
43 |
F |
168 |
62 |
46 |
F |
163 |
57 |
19 |
F |
165 |
59 |
52 |
F |
175 |
69 |
49 |
F |
173 |
64 |
35 |
F |
157 |
46 |
33 |
F |
168 |
60 |
21 |
F |
170 |
53 |
20 |
F |
173 |
59 |
21 |
F |
165 |
51 |
26 |
F |
160 |
56 |
32 |
F |
183 |
60 |
48 |
F |
175 |
58 |
37 |
F |
165 |
60 |
22 |
M |
180 |
77 |
54 |
M |
183 |
75 |
56 |
M |
183 |
75 |
51 |
M |
173 |
74 |
26 |
M |
183 |
78 |
58 |
M |
168 |
61 |
35 |
M |
180 |
86 |
42 |
M |
188 |
81 |
38 |
M |
173 |
69 |
36 |
M |
175 |
77 |
27 |
M |
178 |
79 |
34 |
M |
185 |
75 |
23 |
M |
180 |
77 |
54 |
M |
173 |
79 |
38 |
M |
170 |
78 |
29 |
The analysis was completed using CTREE (http://www.geocities.com/adotsaha/CTree/CtreeinExcel.html). This is a free, simple decision tree that runs in Excel.
Stage 1
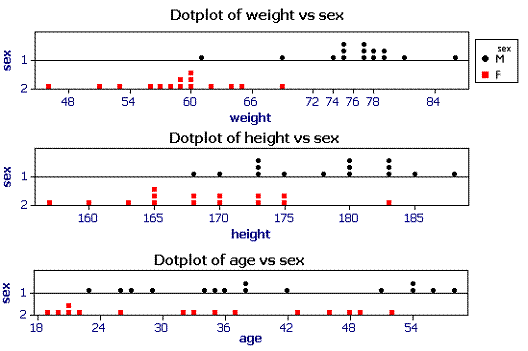
The root node contains all 30 case, 15 males and 15 females. The starting point is finding which variable is the best predictor on a simple binary split. A simple, but repetitive, method is used to find the combination of predictor and split point. In the case of continuous variables (such as these) all possible values for each predictor are tested, e.g. split the cases at weight = 46, 47, 48 ....., height = 151, 152, 153. 154 ..., etc, and find out which of these produces the 'cleanest' split. The aim is to split the data into two groups, ideally one with just males and the other with just females.
1 |
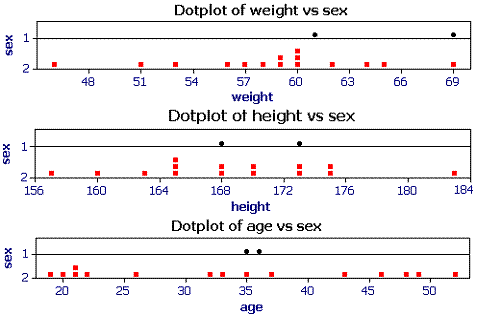
Finding the first splitWhich variable split point gives the best split between the sexes? The dot
plots below help to visualize the mechanism. |
Node 2 is all males (see question feedback) so will not be split further. Node 1 has all of the females and 2 males. In this artificial example node 1 will be split again.
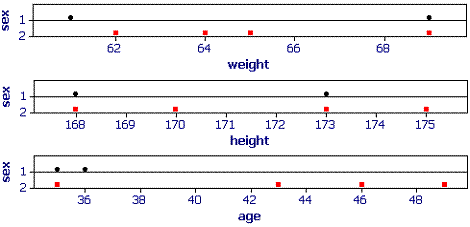
The following dotplots show the Node 1 cases only.

It is less clear how the sexes can be split. The two males are in the middle of the height and age distributions. A split on weight would produce a node with both males and females. The software chooses a split at a weight of 61 kg. Note that this is the same variable used to split the parent node. It is quite normal to use the same variable, with different split points, for different nodes.

Child node 3 is all females so will not be considered again.
2 |
Composition of Node 4Which of the following describes the composition of Node 4? |

The best split is for age. The software chooses age = 37 years as the split point. This will create two mode child nodes, node 5 has two males and one female plus node 6 with three females.

Although node 5 is a mix of two males and one female no further splits are attempted because a stopping rule has been reached (minimum node size to split).
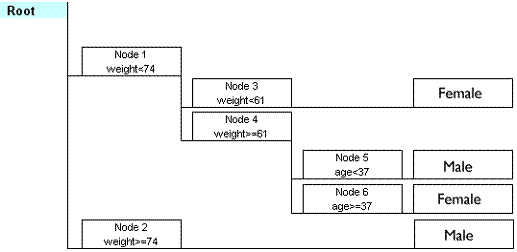
The following shows the decision tree represented by the above decisions. Note that this is slightly modified from the CTREE output.

3 |
Using the treeWhat sex does this tree predict for a person aged 25 years and weighing 72 kg? |
Using a split with a categorical predictor
If one or more predictors is categorical it is slightly more complex because every combination of predictor and response categories has to be evaluated. The number of potential splits is 2(k-1)-1 where k is the number of categories of the predictor variable. The fact that a power function is involved means that the number of potential splits increases very rapidly as the number of categories increases, as shown below. The number of splits is low when there are few categories but beyond eight categories the number of splits starts to become quite large.
Categories |
Splits |
2 |
1 |
3 |
3 |
4 |
7 |
5 |
15 |
8 |
255 |
16 |
32767 |
32 |
2147483647 |
4 |
Calculating categorical splitsHow many splits must be evaluated if you have recorded behavioural categories as locomotion, sleeping, climbing, grooming, drinking and eating? |
Stage 2, pruning the tree, is covered in the next section
