Background
Correspondence analysis (also known as reciprocal averaging) is a technique that is quite widely used in ecology, especially plant ecology. However, it does have much wider applicability (see the examples list). It is an equivalent method to PCA but for data that have been counted rather than measured. In other words where the values of the variables are counts or frequencies.
The term reciprocal averaging is derived from a computationally intensive route of performing the analysis (it can also be done via an eigenanalysis). In very broad terms the algorithm is:
- for each case calculate a score (the case score) that is a weighted average of the variable scores (we begin the process with arbitrary weights).
- using a similar method we obtain variable scores as a weighted average of the case scores.
- repeat steps 1 and 2 until we get to a point when the case and variable scores do not change beyond some minimum value.
At the end of the analysis there are scores on some derived axes for both the cases and the variables. Below is a simple worked example, alternatively you can look at the correspondence analysis page for the ordination web site.
Sample data
In order to understand why this might be useful, imagine that you have collected the following data. Env is some environmental variable (e.g. pH) and variables A - G are species. You have data about their presence / absence in 10 locations. Are there any patterns in these data, are the species present at any location related to the value of the Env variable (A - I)?
	Env. B I D A H E G C
	   4 1 0 1 0 0 0 0 1
	   1 0 0 0 1 0 0 0 0
	   7 0 0 0 0 1 1 1 0
	   8 0 1 0 0 1 0 1 0
	   6 0 0 1 0 0 1 1 0
	   5 0 0 1 0 0 1 0 1
	  10 0 1 0 0 0 0 0 0
	   2 1 0 0 1 0 0 0 0
	   9 0 1 0 0 1 0 0 0
	   3 1 0 0 1 0 0 0 1
In fact there is a very obvious pattern that was obscured by permutating the rows and columns. If the rows ae arranged so that the value of Env is in an ascending order, and arrange the columns to be in alphabetical order the following is obtained.
	Env. A B C D E G H I
	   1 1 0 0 0 0 0 0 0
	   2 1 1 0 0 0 0 0 0
	   3 1 1 1 0 0 0 0 0
	   4 0 1 1 1 0 0 0 0
	   5 0 0 1 1 1 0 0 0
	   6 0 0 0 1 1 1 0 0
	   7 0 0 0 0 1 1 1 0
	   8 0 0 0 0 0 1 1 1
	   9 0 0 0 0 0 0 1 1
	  10 0 0 0 0 0 0 0 1
In this case it was relatively easy to find the structure in the data, but suppose that the value the Env variable was unknown. Could we still identify the same structure in these data?
Analysis
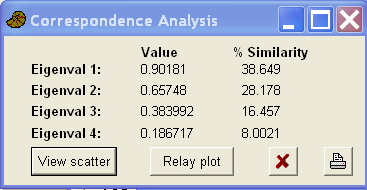
The following is the output from the free PAST software.

Next are the new variable (the species) and case scores on the first four axes.
CA variable scores
	Var. Axis1  Axis2   Axis3   Axis4
	D   0.0177  0.1050  0.0349 -0.0184
	B   0.0754 -0.0365  0.0268  0.0339
	I  -0.0915 -0.1127  0.0616 -0.0246
	A   0.0915 -0.1127 -0.0616 -0.0246
	H  -0.0754 -0.0365 -0.0268  0.0339
	E  -0.0177  0.1050 -0.0349 -0.0184
	G  -0.0508  0.0443 -0.0590  0.0091
	C   0.0508  0.0443  0.0590  0.0091

	CA case scores
	case Axis1  Axis2   Axis3   Axis 4
	4  -0.0875  0.0463 -0.0649  0.0190
	1  -0.0963 -0.0803  0.0574 -0.0329
	7   0.0875  0.0463  0.0649  0.0190
	8   0.1323 -0.0432  0.0130  0.0142
	6   0.0309  0.1045  0.0317 -0.0214
	5  -0.0309  0.1045 -0.0317 -0.0214
	1   0.0963 -0.0803 -0.0574 -0.0329
	2  -0.1242 -0.0751  0.0229  0.0088
	9   0.1242 -0.0751 -0.0229  0.0088
	3  -0.1323 -0.0432 -0.0130  0.0142
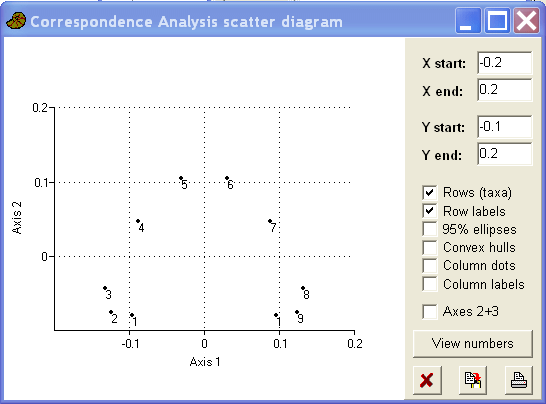
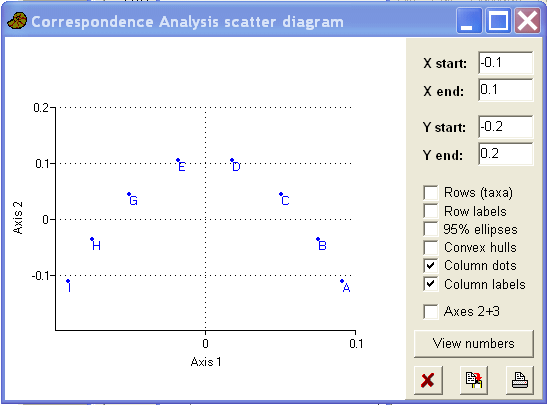
The case and variable scores (on the first two axes) can be plotted and it is obvious from these plots that the analysis has revealed some of the structure in the data (albeit with a curve). Note how the variable plot matches the cases plot.


The arch in the data is a well known problem with CA. It occurs when two axes are highly correlated. The most frequently used (but somewhat controversial) solution to the 'arch effect' is detrending. This is mathematically equivalent to hitting the curve with a hammer until it is flat!
Examples from the literature.
Sheil, D. 1997. Developing tests of successional hypotheses with size-structured populations, and an assessment using long-term data from a Ugandan rain forest. Plant Ecology, 140: 117-127.
Dibog, L, Eggleton, P, Forzi, F. 1998. Seasonality of soil termites in a humid tropical forest, Mbalmayo, southern Cameroon. Journal of Tropical Ecology, 14: 841-849.
Limasset, B, Ojasoo, T, leDoucen, C, Dore, JC. 1999. Inhibition of chemiluminescence in human PMNs by monocyclic phenolic acids and flavonoids. PLANTA MEDICA, 65: 23-29.
Shaw, PJA. 1998. Morphometric analyses of mixed Dactylorhiza colonies (Orchidaceae) on industrial waste sites in England. Botanical Journal of the Linnean Society, 128: 385-401.
Black, WC, Roehrdanz, RL. 1998. Mitochondrial gene order is not conserved in arthropods: Prostriate and metastriate tick mitochondrial genomes. Molecular Biology and Evolution, 15: 1772-1785.
Garcia, S, Finch, DM, Leon, GC. 1998. Patterns of forest use and endemism in resident bird communities of north-central Michoacan, Mexico. Forest Ecology And Management, 110: 151-171.
Dorgeloh, WG. 1998. Habitat selection of a roan antelope (Hippotragus equinus) population in Mixed Bushveld, Nylsvlei Nature Reserve. South African Journal of Wildlife Research, 28: 47-57.
Sieber, TN, Petrini, O, Greenacre, MJ. 1998. Correspondence analysis as a tool in fungal taxonomy. Systematic and Applied Microbiology, 21: 433-441.
Brega, A, Scacchi, R, Cuccia, M, Kirdar, B, Peloso, G, Corbo, RM. 1998. Study of 15 protein polymorphisms in a sample of the Turkish population. Human Biology, 70: 715-728.
Cronin, MTD, Dearden, JC. 1997. Correspondence analysis of the skin sensitization potential of organic chemicals. Quantitative Structure-Activity Relationships, 16: 33-37.

