
Factor Analysis Self Assessment
The following data were obtained from 86 plasma donors at a Liverpool hospital. As part of a much larger data set the following variables were analysed.
Descriptive Statistics
| Mean | Std. Deviation | ||
|---|---|---|---|
| HT | Height (inches!) | 67.37 | 3.97 |
| WT | Weight (pounds!) | 166.22 | 26.67 |
| BMI | Body Mass Index | 26.50 | 3.72 |
| AGE | Age (years) | 33.83 | 8.43 |
| MCV | Mean Cell Volume | 90.60 | 4.26 |
| WBC | White Blood Cell Count | 6.35 | 1.58 |
Significant correlations are maked with a *.
| HT | WT | BMI | AGE | MCV | ||
|---|---|---|---|---|---|---|
| Correlation
Coefficient |
||||||
| WT | 0.534* | |||||
| BMI | -0.228 | 0.679* | ||||
| AGE | 0.039 | 0.100 | 0.112 | |||
| MCV | -0.096 | -0.160 | -0.162 | -0.018 | ||
| WBC | -0.181 | -0.056 | 0.028 | -0.006 | 0.318* | |
Make a note of the significant correlations.
A preliminary PCA identified three eigen values > 1.
Eigenvalue  1.9407  1.3174  1.1144  0.9690  0.6439  0.0146
Proportion   0.323   0.220   0.186   0.162   0.107   0.002
Cumulative   0.323   0.543   0.729   0.890   0.998   1.000


  Variable     PC1     PC2     PC3     PC4     PC5     PC6
  ht         0.395   0.403   0.648  -0.021  -0.135   0.493
  wt         0.671  -0.178   0.227   0.138   0.067  -0.666
  bmi        0.480  -0.532  -0.344   0.154   0.182   0.558
  age        0.152  -0.162  -0.020  -0.974  -0.038  -0.015
  wbc       -0.207  -0.600   0.345   0.087  -0.686   0.018
  mcv       -0.313  -0.370   0.539  -0.026   0.687   0.031
Factor Analysis (Extract only those factors with eigen values > 1).
Principal Component Factor Analysis of the Correlation Matrix
  Variable  Factor1  Factor2  Factor3  Communality
  ht          0.550    0.462    0.684        0.984
  wt          0.934   -0.204    0.240        0.972
  bmi         0.668   -0.611   -0.363        0.951
  age         0.212   -0.186   -0.021        0.080
  wbc        -0.289   -0.688    0.364        0.690
  mcv        -0.436   -0.425    0.569        0.695


  Variance   1.9407   1.3174   1.1144       4.3725
  % Var       0.323    0.220    0.186        0.729

  Rotated Factor Loadings and Communalities
  Varimax Rotation

  Variable  Factor1  Factor2  Factor3  Communality
  ht         -0.015    0.988    0.092        0.984
  wt          0.782    0.594    0.083        0.972
  bmi         0.958   -0.159    0.088        0.951
  age         0.280    0.023   -0.026        0.080
  wbc         0.148   -0.153   -0.803        0.690
  mcv        -0.169    0.026   -0.816        0.695

  Variance   1.6593   1.3791   1.3341       4.3725
  % Var       0.277    0.230    0.222        0.729


  Factor Score Coefficients
  Variable  Factor1  Factor2  Factor3
  ht         -0.130    0.749   -0.043
  wt          0.417    0.355   -0.048
  bmi         0.615   -0.245    0.034
  age         0.175   -0.012   -0.038
  wbc         0.155   -0.041   -0.613
  mcv        -0.064    0.135   -0.627
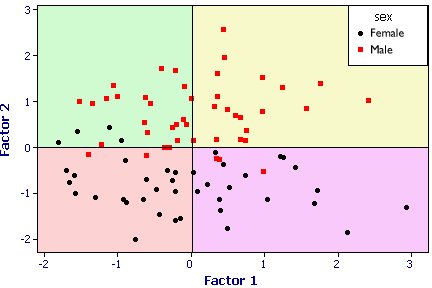
Scatter plot of scores on the two components.
The sex of each case is labelled. The solid lines mark the means for the two components (mean values = 0).
Factor Analysis 2 : Extract 4 factors, with rotation
The same data have been re-analysed, but the default extraction rule has been replaced with an option to extract 4 factors (because the eigen value for the fourth factor was 0.969).
Principal Component Factor Analysis of the Correlation Matrix
    Unrotated Factor Loadings and Communalities
            86 cases used  1 cases contain missing values

    Variable  Factor1  Factor2  Factor3  Factor4  Communality
    ht          0.550    0.462    0.684   -0.021        0.985
    wt          0.934   -0.204    0.240    0.135        0.991
    bmi         0.668   -0.611   -0.363    0.152        0.974
    age         0.212   -0.186   -0.021   -0.959        0.999
    wbc        -0.289   -0.688    0.364    0.085        0.697
    mcv        -0.436   -0.425    0.569   -0.025        0.696

    Variance   1.9407   1.3174   1.1144   0.9690       5.3416
    % Var       0.323    0.220    0.186    0.162        0.890

    Rotated Factor Loadings and Communalities
    Varimax Rotation

    Variable  Factor1  Factor2  Factor3  Factor4  Communality
    ht         -0.028    0.987    0.098   -0.016        0.985
    wt          0.788    0.605    0.050   -0.040        0.991
    bmi         0.973   -0.146    0.045   -0.060        0.974
    age         0.061    0.021    0.006   -0.997        0.999
    wbc         0.128   -0.148   -0.811    0.023        0.697
    mcv        -0.209    0.027   -0.807   -0.016        0.696

    Variance   1.6320   1.3848   1.3237   1.0011       5.3416
    % Var       0.272    0.231    0.221    0.167        0.890

    Factor Score Coefficients
    Variable  Factor1  Factor2  Factor3  Factor4
    ht         -0.144    0.748   -0.034    0.005
    wt          0.430    0.362   -0.068    0.041
    bmi         0.639   -0.236    0.003    0.019
    age        -0.048   -0.015   -0.002   -1.004
    wbc         0.143   -0.037   -0.622    0.030
    mcv        -0.099    0.137   -0.622   -0.033