
PCA graphical explanation
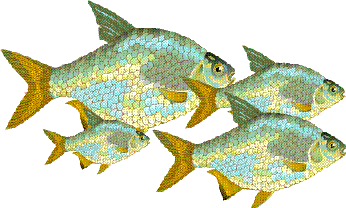
Fish
Essentially PCA is a dimension reduction technique in that points in multidimensional space are projected onto a space of fewer dimensions. The orientation of the projection aids our understanding of any relationships between the points.
It is important to remember that PCA never alters the spatial orientation of the points, with reference to each other. Consider the above fish.
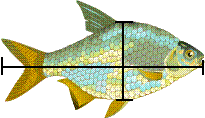
We could measure, for each fish, its length and breadth.
Graphing
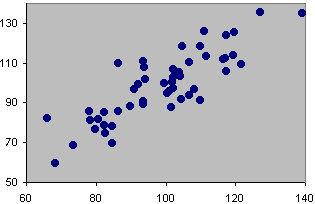
Suppose that 50 fish were measured, the following plot might be obtained. There is an obvious relationship between lenght and breadth, longer fish tend to be broader.
Move the axes so that their origins are now centred on the cloud of points, i.e. 0,0 is at the mean of x and the mean of y. This is a change in the measurement scale. It is what happens when m are changed to cm or from inches to cm, etc. In this case the relevant means were subtracted from each value.
Moving axes
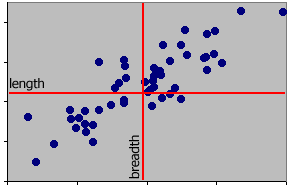
It is important to realise that it is the relationships between points that matters. The relationship between a point and an axis is largely one of convenience for us. Moving the axes does not change the underlying pattern in the data. In the next example the axes have been rotated about their new origin. This rotation has been carried out to fulfil a particular objective.
The objective is to position one axis in such a way that it accounts for the largest proportion of the datas' variance.
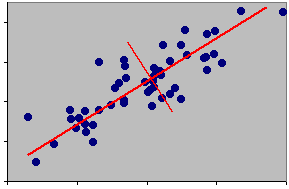
Points form an ellipsoid with the longest axis along a SW - NE line. Hence most of the variation is in that direction. This is the position of the new axis, i.e. along the major axis of the ellipsoid. This is the first component. It may be thought of as a data-projection - literally looking at the data from a different angle.
What might this new axis be called? Think about the relationships between the data point at the bottom left and the data point at the top right, what would these fish look like?
Combining variables
The bottom left fish would be small, while the top right fish is large, albeit with the same shape. In effect the major axis is a new variable, size. At its simplest
size = length + breadth
i.e. a linear combination of the two existing variables, which are given equal weighting.
However, we could make one of the variables more important. Suppose that we consider length to be more important than breadth in the determination of size. In this case we could used weights, or coefficients to introduce differential contributions, for example
size = 0.75 x length + 0.25 x breadth
The interpretation of weights (see later) is very important to a range of multivariate methods. For example, assume that length and breadth had been normalised so that each has a mean of 0 and a variance of 1 we can conclude that length is three times more important than breadth in the construction of the size variable (coefficients of 0.75 and 0.25). If both had 0.5 coefficients we would conclude that they were equally important with respect to size. If length and breath have not been normalised it is more difficult to assess their relative contributions to size, the magnitude of the coefficients will then depend on the relative measurement scales of length and breadth. Suppose that on average length values were four times greater than the breadth values; to make them equally important in the construction of the size variable they would need coefficients of 0.2 (length) and 0.8 (breadth).
For convenience we would normally plot the graph with the x axis horizontal, this would give the appearance of rotating the points rather than the axes.
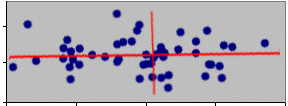
What about the second axis of the ellipse?
A criterion for the second axis is that it should account for as much of the remaining variation as possible. However, it must also be uncorrelated (orthogonal) with the first. This is achieved in a trivial fashion for a 2-dimensional cloud since in order to be orthogonal it must be at right angles to the first axis.
Apart from size, how else do the above fish differ? The answer is not much, apart from some minor differences in shape. If we discard the second axis we would lose information about the different shapes, but since they are all very similar in shape little information would be lost.
Thus, in the above example we can reduce the data's dimensionality from two (length and breadth) to one (size), with little information loss. As we shall see shortly, we can quantify the amount of lost information.
Eigenvalues
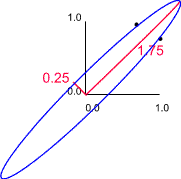
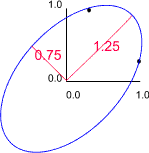
In the above example length and breadth would be highly correlated. Therefore, we expect to find that one of the eigen values of the correlation matrix is larger than the other. For example, suppose the length - breadth correlation was 0.75 we would obtain eigen values of 0.25 and 1.75.
| Correlations as vectors | Rotated to make the major axis horizontal |
|---|---|
 |
 |
In this example the lengths and orientations of these axes are given by the eigen values and eigen vectors of the correlation matrix. If we retain only the 'size' variable we would retain 1.75/2.00 x 100 (87.5%) of the original variation. Thus, if we discard the second axis we would lose 12.5% of the original information.
Size and shape
Suppose, the fish looked like the following collection.

Could you represent these fish by a size variable alone? If not, why not?
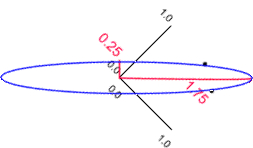
The obvious answer is that they are different sizes and shapes. Retaining just a size variable would lose the information about the different shapes. In these data length and breadth have a relatively low correlation coefficient of 0.25, giving the following eigen values.
| Correlations as vectors | Rotated to make the major axis horizontal |
|---|---|
|
|
|
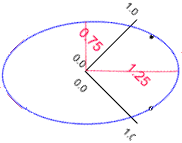
Therefore if we retain only the first axis (size) we would retain only 62.5% (1.25/2.00 x 100) of the original information. Hence we would lose the 37.5% of the information represented by the shape variable.
Instead of using a priori reasoning to define the contributions of the original variables to the new variables we will determine their contributions from the eigen vectors. Recall that the eigen vectors describe the orientation of a new axis, relative to the original variables. These are our measure of the contributions made to the new variables, by the original variables. We then hope that this will provide us with an insight to the information contained within the data that makes some kind of biological sense. These are explored further in the next section.