Data description
The data file is available in two formats
Use your browser's "Save as" function to obtain a copy.
The data
| V1 | V2 | V3 | V4 | V5 |
|---|---|---|---|---|
| 1.53 | 114.01 | 0.75 | 12.65 | 1.96 |
| 0.18 | 79.53 | 0.67 | 13.30 | 5.28 |
| 1.90 | 105.63 | 0.85 | 12.62 | 1.71 |
| 0.91 | 45.62 | 0.11 | 13.14 | 6.24 |
| 1.27 | 79.48 | 0.50 | 12.95 | 3.61 |
| 1.52 | 52.08 | 0.36 | 12.57 | 4.10 |
| 1.32 | 83.87 | 0.58 | 12.77 | 2.53 |
| 1.04 | 33.94 | 0.29 | 12.85 | 0.04 |
| 0.70 | 72.94 | 0.59 | 12.61 | 4.94 |
| 1.54 | 34.22 | 0.30 | 12.99 | 3.66 |
| 0.75 | 50.39 | 0.46 | 12.68 | 6.45 |
| 1.22 | 35.04 | 0.21 | 12.88 | 2.42 |
| 1.31 | 65.25 | 0.70 | 12.76 | 3.98 |
| 0.64 | 0.00 | 0.16 | 12.77 | 3.96 |
| 0.00 | 39.65 | 0.30 | 12.75 | 4.12 |
| 1.93 | 74.27 | 0.71 | 12.65 | 0.00 |
| 2.70 | 96.93 | 0.77 | 12.87 | 1.32 |
| 1.78 | 65.29 | 0.39 | 12.40 | 1.25 |
| 1.71 | 70.57 | 0.52 | 12.46 | 1.36 |
| 0.44 | 75.09 | 0.62 | 12.91 | 4.63 |
| 2.49 | 124.00 | 0.78 | 13.14 | 3.71 |
| 1.61 | 101.89 | 0.66 | 12.92 | 3.57 |
| 0.75 | 15.26 | 0.25 | 12.46 | 0.31 |
| 0.17 | 5.05 | 0.00 | 12.47 | 1.74 |
| 1.13 | 33.39 | 0.36 | 12.75 | 0.46 |
| 1.38 | 81.35 | 0.55 | 13.10 | 4.49 |
| 0.44 | 34.97 | 0.23 | 12.80 | 4.52 |
| 0.47 | 17.89 | 0.11 | 12.71 | 3.53 |
| 1.40 | 60.57 | 0.48 | 12.30 | 0.92 |
| 0.71 | 56.68 | 0.68 | 12.89 | 3.79 |
The obvious points to draw from these simple summary statistics, shown below, are that v2 has a much larger mean than any of the other variables. Secondly, although v4 has a relatively large mean, its standard deviation is small, since most of the other variables have standard deviations that are about 50% of the mean.
| Range | Minimum | Maximum | Mean | Std. Deviation | |
|---|---|---|---|---|---|
| V1 | 2.70 | 0.00 | 2.70 | 1.1657 | 0.6602 |
| V2 | 124.00 | 0.00 | 124.00 | 60.1599 | 31.7576 |
| V3 | 0.85 | 0.00 | 0.85 | 0.4638 | 0.2320 |
| V4 | 1.00 | 12.30 | 13.30 | 12.7708 | 0.2350 |
| V5 | 6.45 | 0.00 | 6.45 | 3.0198 | 1.8057 |
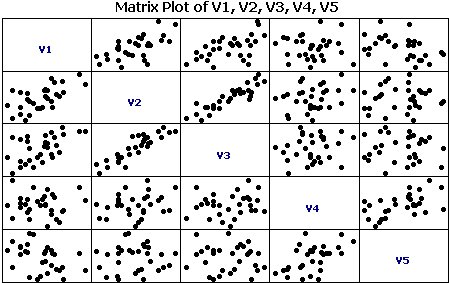
The relationships between the variables are shown below. How many groups of variables can you detect in these plots? (see below for the answer).
| V1 | V2 | V3 | V4 | |
|---|---|---|---|---|
| V2 | 0.631 (0.000) | |||
| V3 | 0.555 (0.001) | 0.895 (0.000) | ||
| V4 | -0.030 (0.877) | 0.244 (0.193) | 0.163 (0.390) | |
| V5 | -0.399 (0.029) | 0.032 (0.867) | -0.045 (0.812) | 0.533 (0.002) |
Figures in () are 2-tailed p values. For example, the correlation between V2 and V3 is 0.895 with a p value of 0.000 and the correlation between V1 and V4 is -0.030 with a p value of 0.877.
Scatter plot

There are two major groups of correlated predictors. The first three variables, v1 - v3 are quite highly intercorrelated, particularly v1 & v2. v4 & v5 are also correlated. The only other significant relationship is the weak, negative correlation between v1 & v5.