Analysis 4 Extracting 3 factors, Varimax rotation and Factor Loading
graphs produced
Since one the main aims of these analyses is reducing the dimensionality
of the data it makes little sense to work with 5 components rather than
5 variables, so how do we decide the number of factors to retain? Several
methods have been suggested, of which the two most common are:
-
Only retain those components/factors whose
eigenvalue is >= 1.000, this would result in the retention of just
the first two components.
- Examine a 'scree plot' of the eigen values against the number of factors.
The appropriate number of factors is given if there is a break in slope.
In this example, three components would seem to be needed.
By default Minitab extracts as many factors as there are variables. If you
wish to have fewer factors extracted this must be specified in the "Number
of factors to extract" box. In this example three are extracted because
of the results from the scree plot.

Factor Analysis: V1, V2, V3, V4, V5
Principal Component Factor Analysis of the Correlation Matrix
Unrotated Factor Loadings and Communalities
Variable Factor1  Factor2  Factor3 Communality
V1      -0.803    0.337    0.342   0.876
V2      -0.947   -0.170   -0.164   0.952
V3      -0.919   -0.099   -0.274   0.929
V4      -0.192   -0.837    0.476   0.964
V5       0.159   -0.894   -0.255   0.889
Variance 2.4480   1.6518   0.5110  4.6108
% Var    0.490    0.330    0.102   0.922
Rotated Factor Loadings and Communalities
Varimax Rotation
Variable Factor1 Factor2 Factor3 Communality
V1       0.575   -0.733   0.091  0.876
V2       0.956   -0.113   0.160  0.952
V3       0.960   -0.076   0.032  0.929
V4       0.115    0.162   0.962  0.964
V5       0.062    0.812   0.475  0.889
Variance 2.1844   1.2406  1.1858 4.6108
% Var    0.437    0.248   0.237  0.922
Sorted Rotated Factor Loadings and Communalities
This is the important section. It shows that:
Variable Factor1  Factor2  Factor3  Communality
V3       0.960    0.000    0.000    0.929
V2       0.956    0.000    0.000    0.952
V5       0.000    0.812    0.475    0.889
V1       0.575   -0.733    0.000    0.876
V4       0.000    0.000    0.962    0.964
Variance 2.1844   1.2406   1.1858   4.6108
% Var    0.437    0.248    0.237    0.922
Factor Score Coefficients
Variable Factor1 Factor2  Factor3
V1       0.036  -0.697    0.333
V2       0.486   0.146   -0.075
V3       0.547   0.265   -0.249
V4      -0.196  -0.319    0.996
V5       0.190   0.711    0.068
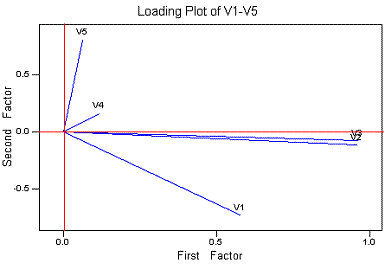
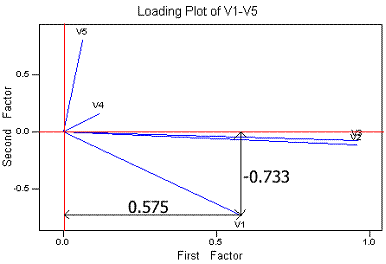
This is the loading plot for Factors 1 and 2. Note that I have added the
red axes

The lines are drawn to the coordinates for a variable that are the factor
loadings. For example, V1 has rotated loadings of 0.575 on Factor 1 and -0.733
on Factor 2.

These plot are interpreted by looking for plots that close (parallel) to
an axis and as long as possible. In the above this shows that Factor 1 (the
horizontal axis) is mainly V2 and V3 while Factor 2 (vertical) is mainly V5.
V1 contributes to both while V4 makes little contribution to either.
Back to PCA Example 1


