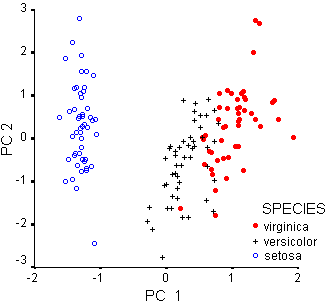
Iris Data : Discriminant Analysis 3 (PC pedictors)
PCA of the 4 predictors
| Initial Eigenvalues | Extraction Sums of Squared Loadings | |||||
|---|---|---|---|---|---|---|
| Component | Total | % Variance | Cumulative % | Total | % Variance | Cumulative % |
| 1 | 2.918 | 72.962 | 72.962 | 2.918 | 72.962 | 72.962 |
| 2 | 0.914 | 22.851 | 95.813 | 0.914 | 22.851 | 95.813 |
| 3 | 0.147 | 3.669 | 99.482 | |||
| 4 | 0.021 | .518 | 100.000 | |||
| Component | ||
|---|---|---|
| 1 | 2 | |
| SEPAL_L | 0.890 | 0.361 |
| SEPAL_W | -0.460 | 0.883 |
| PETAL_L | 0.992 | 0.023 |
| PETAL_W | 0.965 | 0.064 |

Discriminant Analysis using the PCA scores
Summary of Canonical Discriminant Functions
| Function | Eigenvalue | % of Variance | Cumulative % | Canonical Correlation |
|---|---|---|---|---|
| 1 | 17.562 | 99.0 | 99.0 | 0.973 |
| 2 | 0.182 | 1.0 | 100.0 | 0.393 |
| Test of Function(s) | Wilks' Lambda | Chi-square | df | Sig. |
|---|---|---|---|---|
| 1 through 2 | 0.046 | 452.482 | 4 | 0.000 |
| 2 | 0.846 | 24.536 | 1 | 0.000 |
| Function | ||
|---|---|---|
| 1 | 2 | |
| PC1 | 1.094 | 0.034 |
| PC2 | -0.474 | 0.986 |
| Function | ||
|---|---|---|
| 1 | 2 | |
| PC1 | 0.901 | 0.434 |
| PC2 | -0.031 | 1.000 |
| Function | ||
|---|---|---|
| SPECIES | 1 | 2 |
| I.setosa | -5.669 | 0.154 |
| I.versicolor | 1.526 | -0.577 |
| I.virginica | 4.143 | 0.423 |
Classification Statistics
| Predicted Group Membership | Total | |||||
|---|---|---|---|---|---|---|
| SPECIES | I.setosa | I.versicolor | I.virginica | |||
| Original | Count | I.setosa | 50 | 0 | 0 | 50 |
| I.versicolor | 0 | 45 | 5 | 50 | ||
| I.virginica | 0 | 5 | 45 | 50 | ||
| % | I.setosa | 100.0 | .0 | .0 | 100 | |
| I.versicolor | .0 | 90.0 | 10.0 | 100 | ||
| I.virginica | .0 | 10.0 | 90.0 | 100 | ||
| Cross-validated | Count | I.setosa | 50 | 0 | 0 | 50 |
| I.versicolor | 0 | 44 | 6 | 50 | ||
| I.virginica | 0 | 5 | 45 | 50 | ||
| % | I.setosa | 100.0 | .0 | .0 | 100 | |
| I.versicolor | .0 | 88.0 | 12.0 | 100 | ||
| I.virginica | .0 | 10.0 | 90.0 | 100 | ||

