Iris Data : Descriptive statistics
The first analysis examines the variables, by species, to see if their distributions differ from that expected for normally distributed data. A Shapiro-Wilk's test is used. If the p value is <0.05 there is evidence for a departure from normality (marked with * in the table). [skip table]
| Tests of Normality | Shapiro-Wilk | |||
|---|---|---|---|---|
| SPECIES | Statistic | df | p | |
| SEPAL_L | I.setosa | .971 | 50 |
0.430
|
| I.versicolor | .969 | 50 |
0.397
|
|
| I.virginica | .969 | 50 |
0.392
|
|
| SEPAL_W | I.setosa | .977 | 50 |
0.597
|
| I.versicolor | .969 | 50 |
0.399
|
|
| I.virginica | .967 | 50 |
0.346
|
|
| PETAL_L | I.setosa | .956 | 50 |
0.121
|
| I.versicolor | .961 | 50 |
0.232
|
|
| I.virginica | .957 | 50 |
0.134
|
|
| PETAL_W | I.setosa | .801 | 50 |
0.010*
|
| I.versicolor | .940 | 50 |
0.025*
|
|
| I.virginica | .951 | 50 |
0.075
|
|
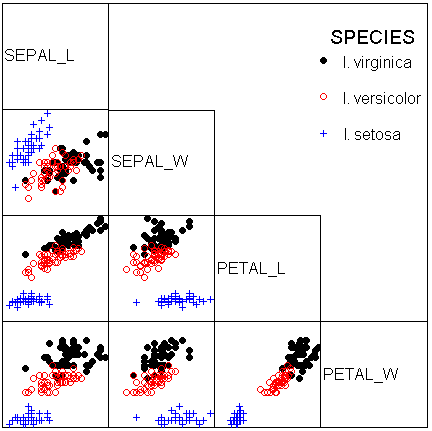
Next are scatter plots of all possible variable pairs, with each species individually marked.

The next table shows descriptive statistics for each variable and each species.
| SPECIES | Mean | SD | |
|---|---|---|---|
| SEPAL_L | I.setosa | 5.006 | .3525 |
| I.versicolor | 5.936 | .5162 | |
| I.virginica | 6.588 | .6359 | |
| SEPAL_W | I.setosa | 3.428 | .3791 |
| I.versicolor | 2.770 | .3138 | |
| I.virginica | 2.974 | .3225 | |
| PETAL_L | I.setosa | 1.462 | .1737 |
| I.versicolor | 4.260 | .4699 | |
| I.virginica | 5.552 | .5519 | |
| PETAL_W | I.setosa | 0.246 | .1054 |
| I.versicolor | 1.326 | .1978 | |
| I.virginica | 2.026 | .2747 |
Next are the results of four analyses of variance (ANOVA). Each ANOVA tests a null hypothesis that the means are the same for each species. The null hypothesis can be rejected if p<0.05.
| Sum of Squares | df | Mean Square | F | Sig. | ||
|---|---|---|---|---|---|---|
| SEPAL_L | Between Groups | 63.212 | 2 | 31.606 | 119.265 | .000 |
| Within Groups | 38.956 | 147 | .265 | |||
| Total | 102.168 | 149 | ||||
| SEPAL_W | Between Groups | 11.345 | 2 | 5.672 | 49.160 | .000 |
| Within Groups | 16.962 | 147 | .115 | |||
| Total | 28.307 | 149 | ||||
| PETAL_L | Between Groups | 437.103 | 2 | 218.551 | 1180.161 | .000 |
| Within Groups | 27.223 | 147 | .185 | |||
| Total | 464.325 | 149 | ||||
| PETAL_W | Between Groups | 80.413 | 2 | 40.207 | 960.007 | .000 |
| Within Groups | 6.157 | 147 | 0.042 | |||
| Total | 86.570 | 149 | ||||
Finally there is a correlation matrix (pooled across all three species). The only insignificant correlation is between sepal width and sepal length.
| SEPAL_L | SEPAL_W | PETAL_L | ||
|---|---|---|---|---|
| SEPAL_W | Pearson Correlation | -.118 | 1.000 | |
| Sig. (2-tailed) | .152 | . | ||
| PETAL_L | Pearson Correlation | .872 | -.428 | 1.000 |
| Sig. (2-tailed) | .000 | .000 | . | |
| PETAL_W | Pearson Correlation | .818 | -.366 | .963 |
| Sig. (2-tailed) | .000 | .000 | .000 | |

