Clustering and Classification methods for Biologists


MMU logo

Logistic Regression SAQ1

LTSN Bioscience logo

Page Outline


Background

This analysis uses the same data as that used in the first logistic regression example. The results of the analysis (using SPSS 12.0) are given below, followed by a series of self-assessment questions. For this analysis the data have have been split, randomly, into 100 training cases and 50 test cases. The training data have 47 class 0 cases and 53 calss 1 cases. In the test data the frequencies are 28 and 22. You may wish to print this material before attempting the questions.

Variables in the Equation


B S.E. Wald df Sig. Exp(B)
Step 0 Constant 0.120 0.200 0.360 1 0.549 1.128


1

Initial value for the constant

Explain why the initial value for the constant is 0.12.

The initial intercept is - LOGe(Proportion in class 1 / Proportion in class 2). These proportions are 0.47 and 0.53 so the initial value for the intercept is -LOGe (0.47/0.53) = -LOGe(0.8868) = 0.12. Check your answer


Omnibus Tests of Model Coefficients


Chi-square df Sig.
Step 1 Step 59.526 4 0.000
Block 59.526 4 0.000
Model 59.526 4 0.000


2

Analysis details

Decide which of the following statements are valid, with respect to this analysis.

a) Variables were selected using a stepwise algorithm.
b) The logistic regression equation has four coefficients.
c) Including the four predictors in the model significantly improved the fit.
d) The initial model deviance was 139.27.
e) The model explains almost 60% of the variation in the predcitors.
f) All four predictor coefficients are significantly greater than 0.
a) Correct, this is a direct-entry model, i.e. no stepwise selection. a) No, this is a direct-entry model, i.e. no stepwise selection. b) There are five coefficients, the constant plus four for the predictors. b) No, there are five coefficients, the constant plus four for the predictors. c) Correct. c) There was a significant improvement as indicated by the Model Chi-square (59.26) and its p value. d) Correct (59.526 + 78.743).d) This is correct. The initial deviance is the model improvement (59.526) + the model's -2LL (78.743). e) Correct, it is variation in the class, not the predictors, that is explained. e) Incorrect, it is variation in the class, not the predictors, that is explained. f) Only b1, b2 and b3 have coefficients significantly greater than 0. f) Only b1, b2 and b3 have coefficients significantly greater than 0. The p value for b4 is greater than 0.05 suggesting that it does not differ significantly from 0.
Check your answer


Model Summary
Step -2 Log likelihood Cox & Snell R Square Nagelkerke R Square
1 78.743 0.449 0.599


Hosmer and Lemeshow Test
Step Chi-square df Sig.
1 3.482 8 0.901

Contingency Table for Hosmer and Lemeshow Test


class = 0 class = 1 Total
Observed Expected Observed Expected
Step 1 1 10 9.788 0 0.212 10
2 8 9.093 2 0.907 10
3 8 8.000 2 2.000 10
4 8 7.047 2 2.953 10
5 6 5.401 4 4.599 10
6 3 3.802 7 6.198 10
7 3 2.172 7 7.828 10
8 1 1.193 9 8.807 10
9 0 0.432 10 9.568 10
10 0 0.072 10 9.928 10

3

Accuracy statistics

Use the calculator from the accuracy page to determine the sensitivity, specificity, false positive rate and kappa for the training and testing data. Comment on any differences.

Sensitivity 0.8333 (training) 0.6786 (testing)

Sensitivity 0.8261 (training) 0.8636 (testing)

False positive rate 0.1739 (training) 0.1364 (testing)

Kappa 0.6584 (training) 0.5628 (testing)
Check your answer


Classification Table(c)

Observed
Predicted
Training Cases Testing Cases
class Percentage Correct class Percentage Correct
0 1 0 1
Step 1 class 0 38 9 80.9 19 9 67.9
1 8 45 84.9 3 19 86.4
Overall Percentage

83.0

76.0
a The cut value is .500.

4

Confidence limits

Complete the following text by selecting the appropriate values.

95% confidence limits for the coefficients were obtained using a z value of . As an example, using b1, the confidence interval is z x 0.140, giving a confidence interval of . This gives a lower confidence limit for Exp(b1) of and uppper confidence limit of . The lower confidence limits for Exp(b) were for b2, for b3 and for b4. Similarly, the upper confidence limits were for b2, for b3 and for b4. The confidence limits for b4 include 1.00 and therefore suggest that this predictor has no effect on the class of a case. This is supported by the p value of for its Wald statistic.

Correct, you appear to understand the calculation and interpretation of the confidence limits. You first find the confidence interval for a coefficient, which is 1.96 (the 2-tailed z value for 95% Confidence limits) multiplied by its s.e. (standard error from the table). This confidence interval is then subtracted, for a lower liimit, and added, for an upper limit, to the coefficient before calculating Exp(confidence limit), where Exp(confidence limit) is e raised to the power of the confidence limit. Check your answer


Variables in the Equation


B S.E. Wald df Sig. Exp(B)
Step 1(a) b1 0.452 0.140 10.417 1 0.001 1.572
b2 0.463 0.123 14.222 1 0.000 1.589
b3 0.309 0.097 10.192 1 0.001 1.363
b4 -.072 0.053 1.896 1 0.169 0.930
Constant -17.251 3.491 24.415 1 0.000 0.000
a Variable(s) entered on step 1: b1, b2, b3, b4.
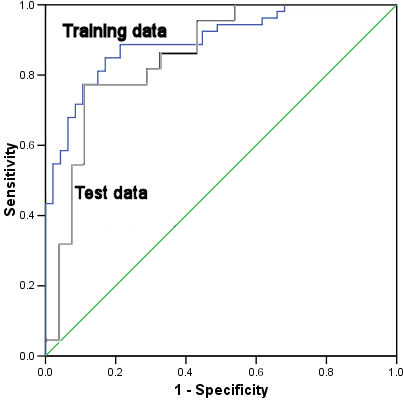
ROC Curve

ROC Curve

5

AUC statistics

The AUC for the training data is significantly larger than the test data AUC.

a) True
b) False
Correct, although the training data AUC is larger, 0.898 compared with 0.859, there is considerable overlap in thair confidence limits.Incorrect, although the training data AUC is larger, 0.898 compared with 0.859, there is considerable overlap in thair confidence limits.
Check your answer
Area Under the Curve for Training Data
Area Std. Error(a) Asymptotic Sig.(b) Asymptotic 95% Confidence Interval
Lower Bound Upper Bound
0.898 0.031 0.000 0.838 0.958
a Under the nonparametric assumption
b Null hypothesis: true area = 0.5

Area Under the Curve for Testing Data
Area Std. Error(a) Asymptotic Sig.(b) Asymptotic 95% Confidence Interval
Lower Bound Upper Bound
0.859 0.053 0.000 0.754 0.963
a Under the nonparametric assumption
b Null hypothesis: true area = 0.5

Scatter of chgdev PRE_1 by class
Histogram of SRE_1
Scatter of COO_1 PRE_1 by class